Data model diagram
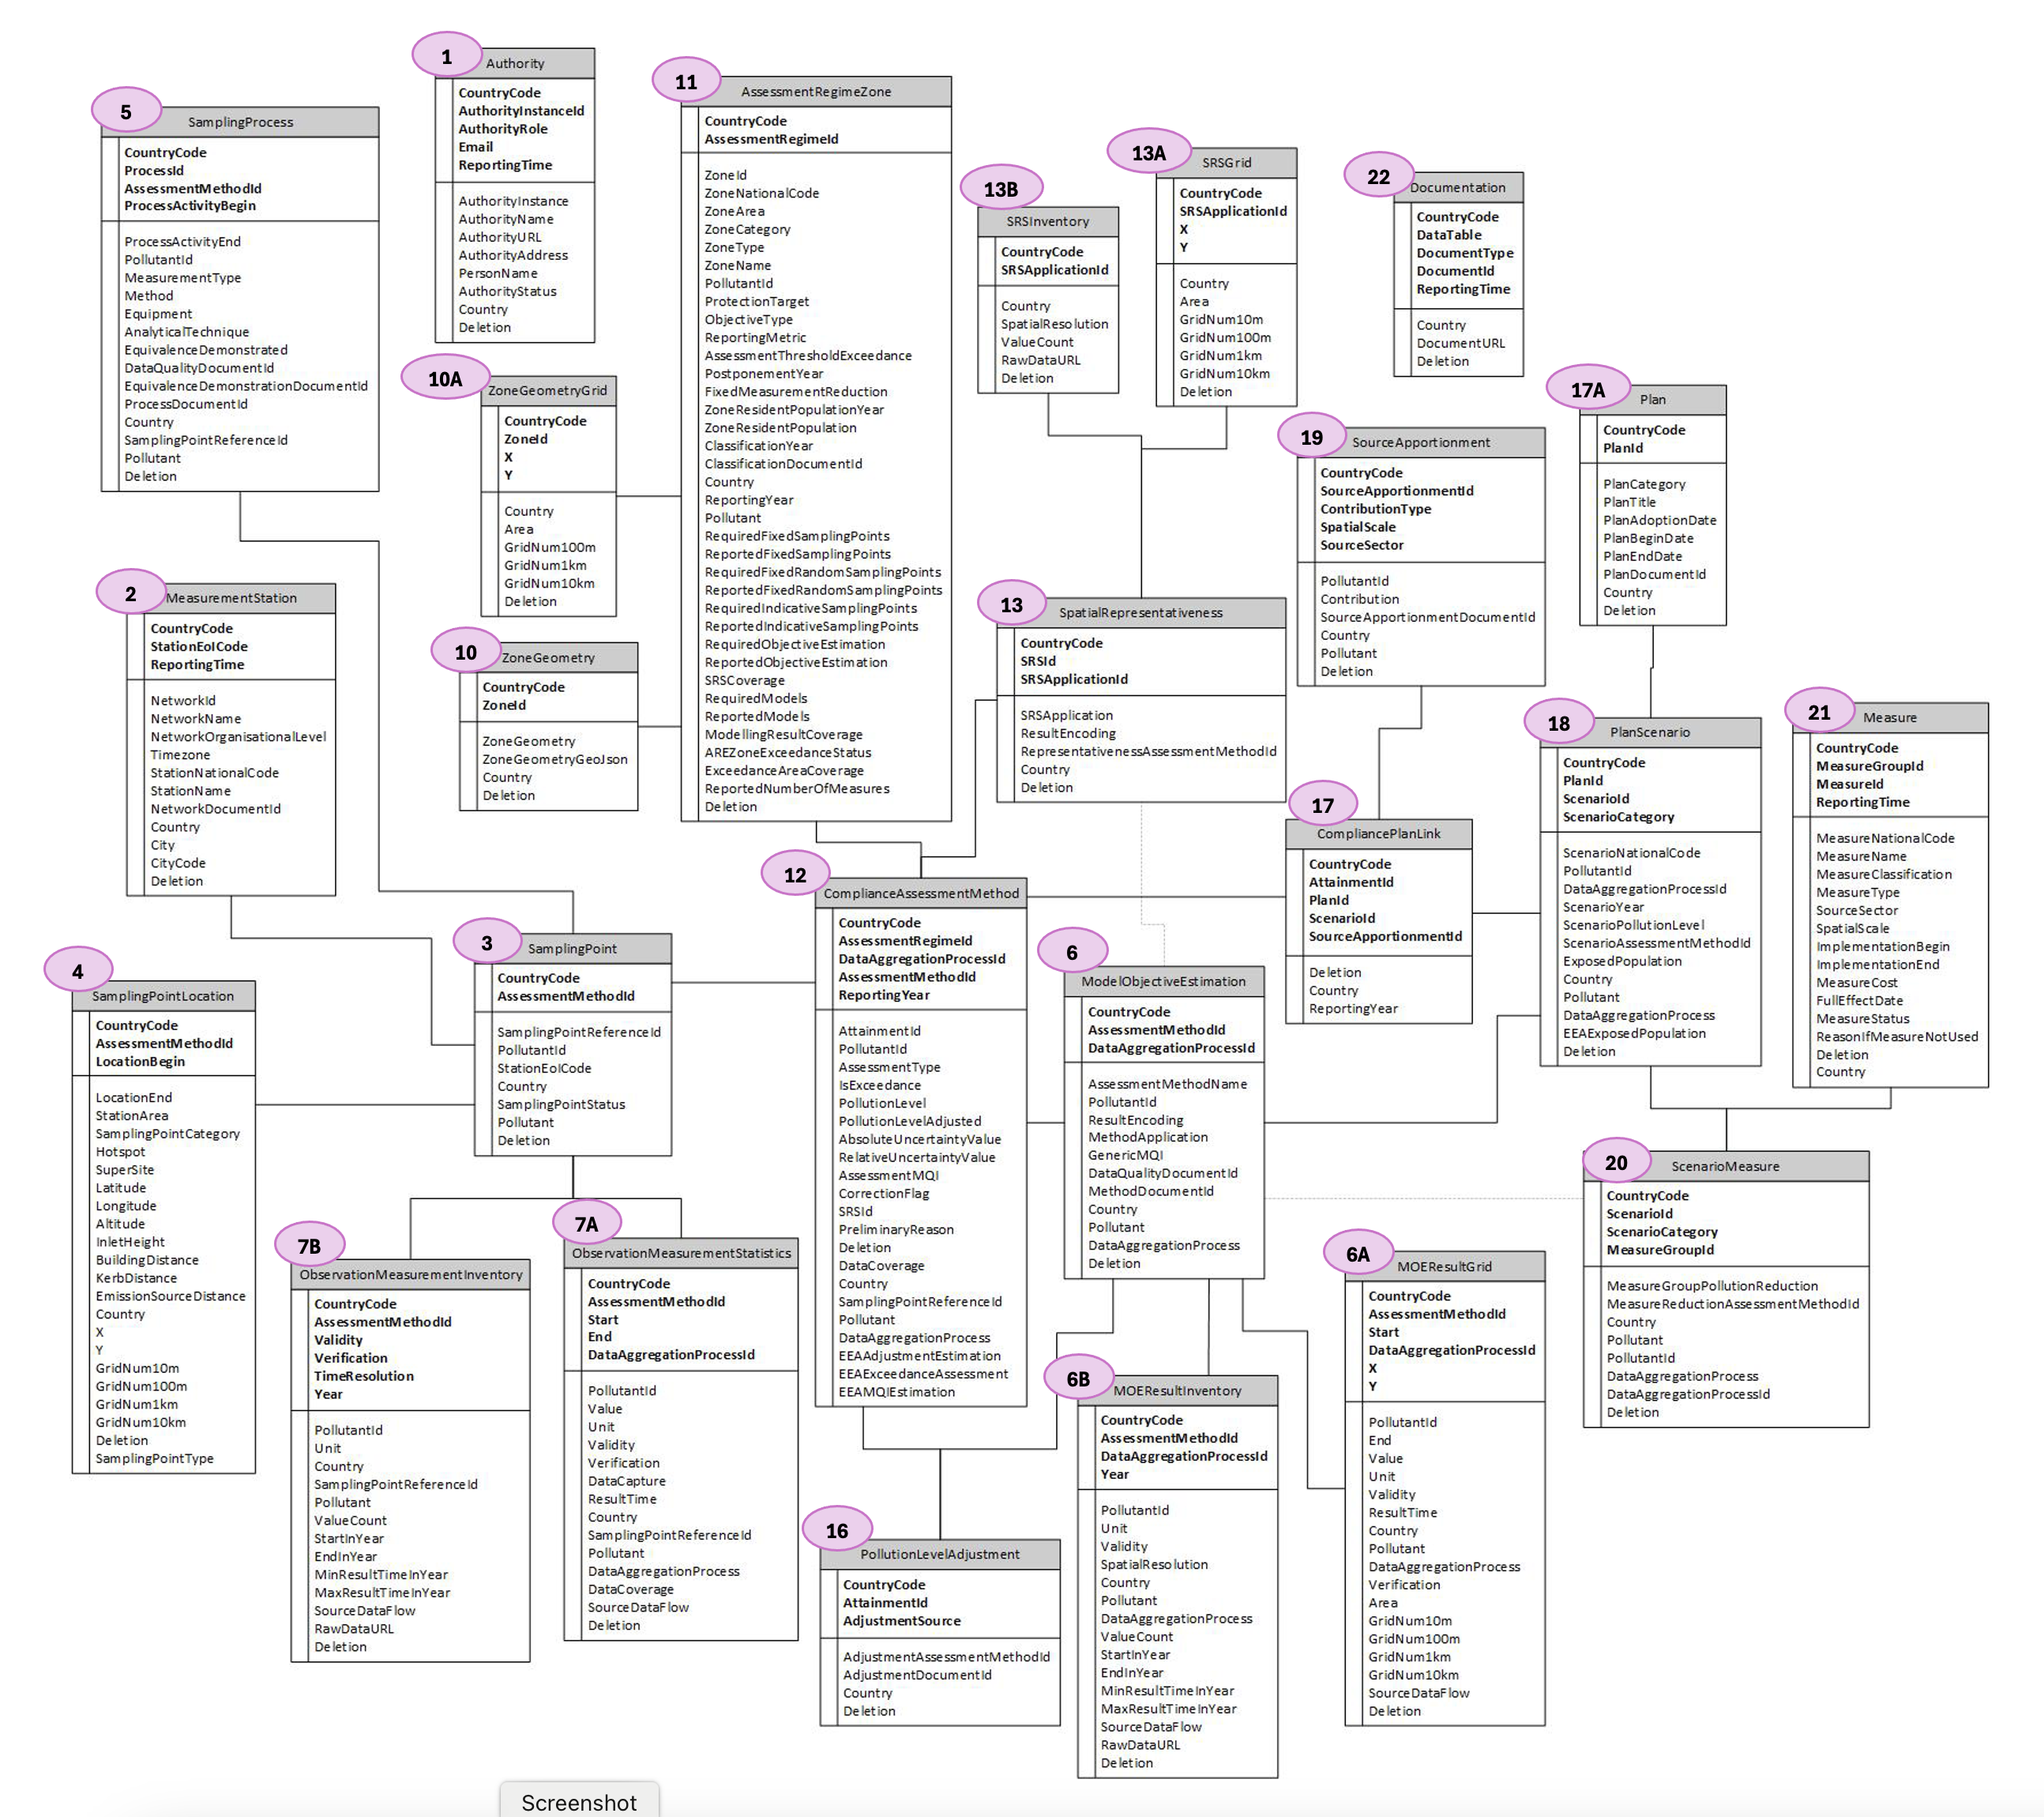
The following diagram provides an overview of the Reportnet air quality reference data model (v502).
Note
The numbering follows the table numbering used in the AQ eReporting data model, allowing corresponding tables to be identified consistently across both guides. The numbers are therefore not always consecutive: missing numbers correspond to reporting tables that are not included in the Reference data model. Additional Reference tables related to an existing numbered table are identified using letter suffixes (A, B, C, etc.).
Tables shown in the diagram
No |
Table |
|---|---|
1 |
|
2 |
|
3 |
|
4 |
|
5 |
|
6 |
|
6A |
|
6B |
|
7A |
|
7B |
|
10 |
|
10A |
|
11 |
|
12 |
|
13 |
|
13A |
|
13B |
|
16 |
|
17 |
|
17A |
|
18 |
|
19 |
|
20 |
|
21 |
|
22 |
|
23 |
|
24 |
|
25 |
|
26 |
|
27 |
|
28 |