
Surface water bodies#
Last update: 2026-06-04
Warning
Public Version - Pending Discussion
Purpose and overview#
This section revises the reporting of information related to Surface Water Bodies in the 2nd and 3rd cycle of reporting of the Water Framework Directive River Basin Management Plans. It also presents a proposal for simplifying the electronic reporting in the 4th cycle.
Current structure - 3rd cycle#
The information about Surface water bodies was reported in five separate schemas:
the SWB_2022 schema, containing information about each surface water body (Figure 62)
the SWMET_2022 schema, containing information about the methodologies (see Surface water methodologies)
the GML_SurfaceWaterBody_2022 schema and GML_SurfaceWaterBodyLine_2022 schema, containing the SurfaceWaterBody spatial dataset.
the GML_SurfaceWaterBodyCentreline_2022 schema, containing the ancillary SurfaceWaterBodyCentreline spatial dataset.
        %%{init: {'theme': 'default'}}%%

classDiagram

class SWChemicalExemptionType ["«XSDcomplexType»
SWChemicalExemptionType"]  {
  «XSElement»
  + swChemicalExemptionType: ExemptionType_Enum
  + swChemicalExemptionPressure: SignificantPressureType_Enum
}


class SWPrioritySubstance ["«XSDcomplexType»
SWPrioritySubstance"]  {
  «XSElement»
  + swPrioritySubstanceCode: PS_Enum
  + swPrioritySubstanceCausingFailure: YesNoUnknownCode_Enum
  + swPrioritySubstanceExceedanceType: EQStandardType_Enum [0..3]
  + swPrioritySubstanceExceedanceInMixingZone: YesNoCode_Enum [0..1]
}

class SWAssociatedProtectedArea ["«XSDcomplexType»
SWAssociatedProtectedArea"]  {
  «XSElement»
  + euProtectedAreaCode: FeatureUniqueEUCodeType
  + protectedAreaType: ProtectedAreaType_Enum
  + protectedAreaObjectivesSet: ProtectedAreaObjectivesEnum [0..1]
  + protectedAreaObjectivesMet: YesNoInformation_Union_Enum [0..1]
  + protectedAreaComment: String1000Type [0..1]
  + protectedAreaExemption: ExemptionType_Enum [1..*]
}

class QualityElement ["«XSDcomplexType»
QualityElement"]  {
  «XSElement»
  + qeCode: StatusQE_Enum
  + qeStatusOrPotentialValue: QEStatusCode_Enum
  + qeMonitoringResults: MonitoringResults_Enum [0..1]
  + qeMonitoringPeriod: YearRangeType [0..1]
  + qeGrouping: FeatureUniqueEUCodeType [0..*]
  + qeStatusOrPotentialChange: ValueQEX_StatusOrPotentialChange_Enum
  + qeStatusOrPotentialComparability: SoPComparability_Enum [0..1]
  + qeEcologicalExemptionType: ExemptionType_Enum [1..*]
}

class FailingRBSP ["«XSDcomplexType»
FailingRBSP"]{
  «XSElement»
  + failingRBSP: RBSP_Enum
  + failingRBSPOther: OtherType [0..1]
}

class SWEcologicalExemptionType ["«XSDcomplexType»
SWEcologicalExemptionType"]  {
  «XSElement»
  + swEcologicalExemptionType: ExemptionType_Enum
  + swEcologicalExemptionPressure: SignificantPressureType_Enum
}

class SurfaceWaterBody ["«XSDcomplexType»
SurfaceWaterBody"]  {
  «XSElement»
  + euSurfaceWaterBodyCode: FeatureUniqueEUCodeType
  + euSubUnitCode: FeatureUniqueEUCodeType
  + surfaceWaterBodyCategory: SWCategoryCode_Enum
  + naturalAWBHMWB: NaturalCode_Enum
  + hmwbWaterUse: HMWBWaterUse_Enum [0..*]
  + hmwbPhysicalAlteration: HMWBPhysicalAlteration_Enum [0..*]
  + reservoir: YesNoUnclearReservoir_Enum [0..1]
  + surfaceWaterBodyTypeCode: String100Type
  + surfaceWaterBodyIntercalibrationType: SWIntercalibrationType_Enum [1..*]
  + surfaceWaterBodyTransboundary: YesNoNotApplicable_Union_Enum
  + swSignificantPressureType: SignificantPressureType_Enum [1..*]
  + swPressureOther: String1000Type [0..1]
  + swSignificantImpactType: SignificantImpactType_Enum [1..*]
  + swSignificantImpactOther: String1000Type [0..1]
  + swEcologicalStatusOrPotentialValue: EcologicalStatusCode_Enum
  + swEcologicalAssessmentYear: YearRangeType
  + swEcologicalAssessmentConfidence: Confidence_Enum
  + swEcologicalStatusOrPotentialExpectedAchievementDate: GoodStatus_Enum
  + swChemicalStatusValue: StatusCode_Enum
  + swChemicalAssessmentYear: YearRangeType
  + swChemicalAssessmentConfidence: Confidence_Enum
  + swChemicalMonitoringResults: ChemicalMonitoringResults_Enum [0..1]
  + swChemicalStatusGrouping: FeatureUniqueEUCodeType [0..*]
  + swChemicalStatusExpectedAchievementDate: GoodStatus_Enum
  + swMixingZones: YesNoNoInformation_Union_Enum
  + swMixingZonesProportion: NumberPercentageType [0..1]
}

class SWB {
  ["«XSDcomplexType»
SWB"]
  «XSElement»
  + countryCode: CountryCode_Enum
  + euRBDCode: FeatureUniqueEUCodeType
}

SWChemicalExemptionType --> SWPrioritySubstance : SWChemicalExemptionType
SWPrioritySubstance --> SurfaceWaterBody : SWPrioritySubstance
SWAssociatedProtectedArea --> SurfaceWaterBody : SWAssociatedProtectedArea
QualityElement --> SurfaceWaterBody : QualityElement
FailingRBSP --> SurfaceWaterBody : FailingRBSP
SWEcologicalExemptionType --> SurfaceWaterBody : SWEcologicalExemptionType
SurfaceWaterBody --> SWB : SurfaceWaterBody
Figure 62 Class diagram for the SWB_2022 schema in the 3rd cycle of reporting.#
SWB_2022 schema - 3rd cycle#
The SWB_2022 schema was already partially revised with regard to the reporting of exemptions. See:
Other simplifications already discussed also apply to the revision of the SWB schema:
Removal of the textual reporting of “other” pollutants or RBSPs
Removal of the textual reporting of “other” pressures
Removal of the textual reporting of “other” impacts
Removal of the reporting of subunits
Figure 63 shows a simplified diagram to help focus the discussion on the remaining issues.
        %%{init: {'theme': 'default'}}%%

classDiagram


class SWPrioritySubstance {

  + swPrioritySubstanceCode: PS_Enum
  + swPrioritySubstanceCausingFailure: YesNoUnknownCode_Enum
  + swPrioritySubstanceExceedanceType: EQStandardType_Enum [0..3]
  + swPrioritySubstanceExceedanceInMixingZone: YesNoCode_Enum [0..1]
}

class FailingRBSP {
  + failingRBSP: RBSP_Enum

}

class QualityElement {

  + qeCode: StatusQE_Enum
  + qeStatusOrPotentialValue: QEStatusCode_Enum
  + qeMonitoringResults: MonitoringResults_Enum [0..1]
  + qeMonitoringPeriod: YearRangeType [0..1]
  + qeGrouping: FeatureUniqueEUCodeType [0..*]
  + qeStatusOrPotentialChange: ValueQEX_StatusOrPotentialChange_Enum
  + qeStatusOrPotentialComparability: SoPComparability_Enum [0..1]
}

class SurfaceWaterBody   {

  + euSurfaceWaterBodyCode: FeatureUniqueEUCodeType
  + surfaceWaterBodyCategory: SWCategoryCode_Enum
  + naturalAWBHMWB: NaturalCode_Enum
  + hmwbWaterUse: HMWBWaterUse_Enum [0..*]
  + hmwbPhysicalAlteration: HMWBPhysicalAlteration_Enum [0..*]
  + reservoir: YesNoUnclearReservoir_Enum [0..1]
  + surfaceWaterBodyTypeCode: String100Type
  + surfaceWaterBodyIntercalibrationType: SWIntercalibrationType_Enum [1..*]
  + surfaceWaterBodyTransboundary: YesNoNotApplicable_Union_Enum
  + swSignificantPressureType: SignificantPressureType_Enum [1..*]
  + swSignificantImpactType: SignificantImpactType_Enum [1..*]
  + swEcologicalStatusOrPotentialValue: EcologicalStatusCode_Enum
  + swEcologicalAssessmentYear: YearRangeType
  + swEcologicalAssessmentConfidence: Confidence_Enum
  + swChemicalStatusValue: StatusCode_Enum
  + swChemicalAssessmentYear: YearRangeType
  + swChemicalAssessmentConfidence: Confidence_Enum
  + swChemicalMonitoringResults: ChemicalMonitoringResults_Enum [0..1]
  + swChemicalStatusGrouping: FeatureUniqueEUCodeType [0..*]
  + swMixingZones: YesNoNoInformation_Union_Enum
  + swMixingZonesProportion: NumberPercentageType [0..1]
}

SWPrioritySubstance --> SurfaceWaterBody : SWPrioritySubstance
FailingRBSP --> SurfaceWaterBody : FailingRBSP
QualityElement --> SurfaceWaterBody : QualityElement
Figure 63 PARTIAL class diagram for the SWB_2022 schema in the 3rd cycle of reporting.#
Surface water - descriptive data - 4th cycle#
The proposed structure for the 4th cycle electronic reporting is presented in the class diagram in (Figure 64) and a brief description of each table is included in Table 56.
        ---
config:
  class:
    hideEmptyMembersBox: true
  layout: dagre
  theme: neutral
---
classDiagram
direction TB

class SurfaceWaterBody {
    + euSurfaceWaterBodyCode: wiseIdentifier
    + surfaceWaterBodyCategory: WaterBodyCategory
    + naturalAWBHMWB: NaturalAWBHMWB
    + swIntercalibrationType: IntercalibrationType [1..n]
    + swTypeIdentifier: wiseIdentifier
    + surfaceWaterBodyTransboundary: YesNo
    + reservoir: ReservoirType
    + swMixingZonesProportion: PercentageInterval
}

class SWStatus {
    + euSurfaceWaterBodyCode: wiseIdentifier
    + swEcologicalStatusOrPotentialValue: EcologicalStatus
    + swChemicalStatusValue: ChemicalStatus
}

class SWPollutant {
    + euSurfaceWaterBodyCode: wiseIdentifier
    + swPollutantCode: Parameter
    + swPollutantCausingFailure: YesNoUnknown
    + swThresholdExceedance: wiseIdentifier [0..n]
    + swPollutantExceedanceInMixingZone: YesNoUnknownNotApplicable

    + swPollutantAssessmentPeriod: range
    + swPollutantAssessmentMethod: AssessmentMethod [1..n]
    + swPollutantAssessmentConfidence: AssessmentConfidence

    + swThresholdIdentifier: wiseIdentifier [1..n]
    + swGroupingIdentifier: wiseIdentifier [0..n]
}

class SWPressureImpact {
    + euSurfaceWaterBodyCode: wiseIdentifier
    + swPressureType: PressureType [0..1]
    + swImpactType: ImpactType  [0..1]
}

class SWHeavilyModifiedWaterBody {
    + euSurfaceWaterBodyCode: wiseIdentifier
    + hmwbPhysicalAlteration: HMWBPhysicalAlteration [0..n]
    + hmwbWaterUse: HMWBWaterUse [0..n]
}

class SWQualityElement{
    + euSurfaceWaterBodyCode: wiseIdentifier
    + qeCode: QualityElement
    + qeStatusOrPotentialValue: EcologicalStatus
    + qeStatusAssessmentPeriod: range
    + qeStatusAssessmentMethod: AssessmentMethod [1..n]
    + qeStatusAssessmentConfidence: AssessmentConfidence
    + qeClassificationIdentifier: wiseIdentifier [1..n]
    + swGroupingIdentifier: wiseIdentifier [0..n]
}
class SWGrouping{
    + swGroupingIdentifier: wiseIdentifier
    + euSurfaceWaterBodyCode: wiseIdentifier
}

SWHeavilyModifiedWaterBody "0..n" -- "1" SurfaceWaterBody
SurfaceWaterBody "1" -- "1" SWStatus
SWStatus "1" -- "0..n" SWQualityElement
SWStatus "1" -- "0..n" SWPressureImpact
SWStatus "1" -- "0..n" SWPollutant

SWQualityElement ..> SWGrouping: swGroupingIdentifier
SWPollutant ..> SWGrouping: swGroupingIdentifier

classDef default fill:white,stroke:#000;
classDef forFixing fill:white,stroke:#f00;
classDef otherDataset fill:lightyellow,stroke:#000;
Figure 64 Surface water - 4th cycle#
Table |
Description |
|---|---|
SurfaceWaterBody |
modified |
SWHeavilyModifiedWaterBody |
modified |
SWStatus |
new Formally, the Likewise, the |
SWPollutant |
modified |
SWQualityElement |
new |
SWGrouping |
new The |
SWPressureImpact |
modified. For water bodies that do not achieve good chemical status in 2027,
the significant pressures are reported in the For cases where a pressure is not causing failure,
but still causes an impact that needs to be managed,
the Note that the reporting of pressures and impacts
is combined into a single |
Surface water - codelists - 4th cycle#
For the
Reservoircodelist, see Figure 65.
All reservoirs must be reported as artificial or heavily modified lakes.See the definitions in Table 57.
For the
HMWBWaterUsecodelist, see Figure 65.
For heavily modified water bodies only, use this codelist to report the water use for which the water body has been designated. According to Art. 4(3) of the WFD, the water use for which a HMWB was designated is the water use that would be affected significantly by the changes that would be necessary to achieve good ecological status.For the
HMWBPhysicalAlterationcodelist, see Figure 65.
For heavily modified water bodies only, use this codelist to report the physical alteration that has resulted in the designation of the surface water body as a HMWB.
In the context of designation as a HMWB, physical alterations means any significant alterations that have resulted in substantial changes to the hydromorphology of a surface water body such that the surface water body is substantially changed in character. In general, these hydromorphological characteristics are long term and alter both the morphological and hydrological characteristics.For the
AssessmentMethodcodelist, see Figure 51.
The codelist is used to report the assessment method for the chemical status and the assessment method for the ecological status.
The same codelist is used for groundwater bodies, to report the assessment method of quantitative status, and the assessment method of chemical status.See the definitions in Table 47.
For the
AssessmentConfidencecodelist, see also Figure 51.
The codelist allow the reporting of the level of confidence in the results of the status assessment The same codelist is used for groundwater bodies.See the definitions in Table 48.
For the
PressureTypecodelist, see Figure 86 in the section PressureType codelist - 4th cycle
        ---
config:
  class:
    hideEmptyMembersBox: true
  layout: dagre
  theme: neutral
---
classDiagram
direction TB

class HMWBWaterUse{
<<enumeration>>
  widerEnvironment_natureProtection
  widerEnvironment_culturalHeritageProtection
  transport
  tourism
  urban_drinkingWaterSupply
  agriculture_irrigation
  aquaculture
  industry_waterSupply
  energy_hydropower
  energy_nonHydropower
  floodProtection
  agriculture_landDrainage
  urban_other
  otherSustainableHumanDevelopmentActivities
  unknown
}

class HMWBPhysicalAlteration{
<<enumeration>>
  locks
  transversalBarrier
  longitudinalBarrier
  dredging
  landReclamation
  landDrainage
  other
}

class Reservoir{
<<enumeration>>
  river
  riverAndLake
  lake
  artificial
  notAReservoir
  inapplicable
}

classDef default fill:white,stroke:#000;
classDef forFixing fill:white,stroke:#f00;
Figure 65 Reservoir codelist, HMWBWaterUse codelist, and HMWBPhysicalAlteration codelist - 4th cycle#
Notation |
Label |
Definition |
|---|---|---|
river |
Reservoir in former river |
Select this option only if the whole surface water body represents a reservoir (or part of a reservoir) created by damming a river. |
riverAndLake |
Reservoir in former chain of rivers and lakes |
In cases where the reservoir has been created by damming a water body which contained chained rivers and lakes. |
lake |
Reservoir in former lake |
If the whole surface water body represents a reservoir (or part of a reservoir) created by modifying a pre-existing lake, or if the surface water body includes some small reservoirs which are not significant enough to be identified as separate surface water bodies. |
artificial |
Artificial reservoir |
In cases where the reservoir has been created by human activity in a location where no water body existed before, and which has not been created by the direct physical alteration, movement or realignment of an existing water body. |
notAReservoir |
Not a reservoir |
The artificial or heavily modified lake is not a reservoir. |
inapplicable |
Inapplicable |
The water body is not a lake, or is a natural lake. |
Notation |
Label |
Definition |
|---|---|---|
widerEnvironment_natureProtection |
Nature protection |
See Article 4(3)(a)(i) of the WFD. |
widerEnvironment_culturalHeritageProtection |
Cultural heritage protection |
Archaeological sites and patrimony. See Article 4(3)(a)(i) of the WFD. |
transport_navigation |
Transport - Navigation and Ports |
See Article 4(3)(a)(ii) of the WFD. |
tourism |
Tourism and recreation |
See Article 4(3)(a)(ii) of the WFD. |
urban_drinkingWaterSupply |
Urban development - drinking water supply |
Water storage for domestic public water supply (mostly drinking water supply). See Article 4(3)(a)(iii) of the WFD. |
agriculture_irrigation |
Agriculture - irrigation |
Water storage for irrigation. See Article 4(3)(a)(iii) of the WFD. |
aquaculture |
Aquaculture, fisheries, fish farms |
Water storage for aquaculture, fisheries, fish farms. See Article 4(3)(a)(iii) of the WFD. |
industry_waterSupply |
Industry - water supply |
Water storage for industry. See Article 4(3)(a)(iii) of the WFD. |
energy_hydropower |
Energy – hydropower |
Water storage for hydropower generation. See Article 4(3)(a)(iii) of the WFD. |
energy_nonHydropower |
Energy – non-hydropower |
Water storage for power generation. See Article 4(3)(a)(iii) of the WFD. Applicable to cooling activities for thermal and nuclear plants. |
floodProtection |
Flood protection |
See Article 4(3)(a)(iv) of the WFD. |
agriculture_landDrainage |
Agriculture - land drainage |
See Article 4(3)(a)(iv) of the WFD. |
urban_other |
Urban development - other use |
«to be provided» |
otherSustainableHumanDevelopmentActivities |
Other sustainable human development activities |
See Article 4(3)(a)(v) of the WFD. |
unknown |
Unknown |
Unknown use. The selection of this option will trigger an ERROR. |
Click to see the mapping table between 3rd cycle and 4th cycle codes
3rd cycle |
4th cycle |
|---|---|
“Wider environment - nature protection and other ecological uses” |
widerEnvironment_natureProtection |
“Wider environment - nature protection and other ecological uses” |
widerEnvironment_culturalHeritageProtection |
“Transport - navigation / ports” |
transport |
“Tourism and recreation” |
tourism |
“Urban development - drinking water supply” |
urban_drinkingWaterSupply |
“Agriculture - irrigation” |
agriculture_irrigation |
“Storage for fisheries/aquaculture/fish farms” |
aquaculture |
“Industry supply” |
industry_waterSupply |
“Energy - hydropower” |
energy_hydropower |
“Energy - non-hydropower” |
energy_nonHydropower |
“Flood protection” |
floodProtection |
“Agriculture - land drainage” |
agriculture_landDrainage |
“Urban development - other use” |
urban_other |
“Other” |
otherSustainableHumanDevelopmentActivities |
“Unknown” |
unknown |
Notation |
Label |
Definition [1] |
|---|---|---|
locks |
locks |
Locks: devices for raising and lowering boats between stretches of water of different levels on river and canal waterways. |
transversalBarrier |
Transversal barrier |
Includes: Weirs / dam / reservoir: transversal barriers constructed across a river or a lake discharge for the purpose of creating a water impoundment. |
longitudinalBarrier |
Longitudinal barrier |
Includes: Channelisation / straightening / bed stabilisation: any permanent modification which longitudinally affects river banks and/or river bed, including changing direction, reducing meandering, stabilisation of river banks, etc. |
dredging |
Dredging |
Includes: Dredging / channel maintenance: modifications due to regular maintenance of rivers through dredging for any given purpose, usually navigation or flood protection. |
landReclamation |
Land reclamation |
Includes: Land reclamation / coastal modifications / ports: modifications of a water body as a result of the creation of new land from ocean, riverbeds, or lakes (e.g. for the purpose of expanding or creating a port). |
landDrainage |
Land drainage |
Modification of a water body as a result of an artificial change to the water level intended to make available existing land for a particular purpose (often for agricultural production or for urbanisation). |
other |
Other |
Other alteration not included in any of the categories above. |
Click to see the mapping table between 3rd cycle and 4th cycle codes
3rd cycle |
4th cycle |
|---|---|
“Locks” |
locks |
“Weirs / dam / reservoir” |
transversalBarrier |
“Channelisation / straightening / bed stabilisation / bank reinforcement” |
longitudinalBarrier |
“Dredging / channel maintenance” |
dredging |
“Land reclamation / coastal modifications / ports” |
landReclamation |
“Land drainage” |
landDrainage |
“Other” |
other |
Ecological status and potential#
The diagram below, adapted from Figure 1 in the CIS Guidance Document 13, illustrates the assessment criteria for ecological status (Figure 66).
        ---
config:
  layout: dagre
---

flowchart LR

title@{ shape: braces, label: "CIS Guidance document 13, Figure 1" }

    %% Defining the nodes

    initial([start])
    final([end])

    High["High status"]:::Blue
    Good["Good status"]:::Green
    Moderate["Moderate status"]:::Yellow
    Poor["Poor status"]:::Orange
    Bad["Bad status"]:::Red

    is_BQE_High{"Do the <br/>estimated values <br/>for the biological quality elements <br/>meet reference conditions?"}
    is_BQE_Good{"Do the <br/>estimated values <br/>for the biological quality elements <br/>deviate only slightly <br/>from reference condition values?"}

    is_PhysChemQE_High{"Do the <br/>physico-chemical conditions <br/>meet high status?"}
    is_PhysChemQE_Good{"Do the <br/>physico-chemical conditions <br/>ensure ecosystem functioning?"}

    is_HyMoQE_High{"Do the <br/>hydro-morphological conditions<br/> meet high status?"}

    ClassifyUsingBQEOnly["Classify <br/>on the basis of the <br/>biological deviation <br/>from reference conditions"]
    is_BQE_Moderate{"Is the <br/>deviation moderate?"}
    is_BQE_Poor{"Is the <br/>deviation large?"}

    %% Flow

    initial --> is_BQE_High

    is_BQE_High ====> |Yes|is_PhysChemQE_High
    is_PhysChemQE_High ==>|Yes|is_HyMoQE_High
    is_HyMoQE_High ==>|Yes| High
    High --> final

    is_HyMoQE_High ==> |No|Good
    is_PhysChemQE_High ==>|No|is_PhysChemQE_Good

    is_BQE_High ==>|No|is_BQE_Good
    is_BQE_Good ==>|Yes|is_PhysChemQE_Good
    is_BQE_Good ==>|No|ClassifyUsingBQEOnly
    is_PhysChemQE_Good ==>|Yes|Good
    Good --> final

    is_PhysChemQE_Good ==>|No|ClassifyUsingBQEOnly
    ClassifyUsingBQEOnly ==> is_BQE_Moderate
    is_BQE_Moderate ==>|Yes|Moderate
    Moderate --> final

    is_BQE_Moderate ==>|No|is_BQE_Poor
    is_BQE_Poor ==>|Yes|Poor
    Poor --> final

    is_BQE_Poor ==>|Extreme deviation|Bad
    Bad --> final

    %% styling
    classDef state stroke-width:4px,fill:transparent
    classDef Blue fill:#5893A9,stroke:black;
    classDef Green fill:#6FB22C,stroke:black;
    classDef Yellow fill:#FFF6A6,stroke:black;
    classDef Orange fill:#F6A800,black;
    classDef Red fill:#E63D5C,black;
Figure 66 Surface Water Body - Ecological status assessment#
The diagram below, adapted from Figure 2 in the CIS Guidance document 13, illustrates the assessment criteria for ecological potential (Figure 67).
        ---
config:
  layout: dagre
---

flowchart LR

title@{ shape: braces, label: "CIS Guidance document 13, Figure 2" }

    %% Defining the nodes

    initial([start])
    final([end])

    Good["Good and above potential"]:::Green
    Moderate["Moderate potential"]:::Yellow
    Poor["Poor potential"]:::Orange
    Bad["Bad potential"]:::Red

    is_HyMoQE_Good{"Do the <br/>hydro-morphological conditions <br/>meet maximum ecological potential?"}
    is_BQE_High{"Do the <br/>estimated values <br/>for the biological quality elements <br/>meet maximum ecological potential conditions?"}
    is_BQE_Good{"Do the <br/>estimated values <br/>for the biological quality elements <br/>deviate only slightly from maximum ecological potential values?"}

    is_PhysChemQE_High{"Do the <br/>physico-chemical conditions <br/>meet maximum ecological potential?"}
    is_PhysChemQE_Good{"Do the <br/>physico-chemical conditions <br/>ensure ecosystem functioning?"}

    ClassifyUsingBQEOnly["Classify <br/>on the basis of the <br/>biological deviation <br/>from maximum ecological potential conditions"]
    is_BQE_Moderate{"Is the <br/>deviation moderate?"}
    is_BQE_Poor{"Is the <br/>deviation large?"}

    %% Flow

    initial --> is_HyMoQE_Good

    is_HyMoQE_Good ==> |Yes|is_BQE_High
    is_BQE_High ====> |Yes|is_PhysChemQE_High
    is_PhysChemQE_High ==>|Yes|Good

    is_PhysChemQE_High ==>|No|is_PhysChemQE_Good
    is_PhysChemQE_Good ==>|Yes|Good

    is_HyMoQE_Good ==> |No|is_BQE_Good
    is_BQE_High ==>|No|is_BQE_Good
    is_BQE_Good ==>|Yes|is_PhysChemQE_Good

    Good --> final

    is_PhysChemQE_Good ==>|No|Moderate

    is_BQE_Good ==>|No|ClassifyUsingBQEOnly
    ClassifyUsingBQEOnly ==> is_BQE_Moderate
    is_BQE_Moderate ==>|Yes|Moderate
    Moderate --> final

    is_BQE_Moderate ==>|No|is_BQE_Poor
    is_BQE_Poor ==>|Yes|Poor
    Poor --> final

    is_BQE_Poor ==>|Extreme deviation|Bad
    Bad --> final

    %% styling
    classDef state stroke-width:4px,fill:transparent
    classDef Blue fill:#5893A9,stroke:black;
    classDef Green fill:#6FB22C,stroke:black;
    classDef Yellow fill:#FFF6A6,stroke:black;
    classDef Orange fill:#F6A800,black;
    classDef Red fill:#E63D5C,black;
Figure 67 Surface Water Body - Ecological potential assessment#
Annexes - Data analysis - 3rd cycle#
Changes to the quality check during the 3rd cycle reporting phase
Several data quality issues where detected while the 3rd cycle was ongoing (i.e. after the testing phase).
That required the implementation of additional quality checks, or the correction of existing quality checks.
For example, the reporting guidance was not always clear in the distinction between conditions in the form “if A then B” versus conditions in the form if and only if A then B.
On a case-by-case decision, resubmissions may have been requested or not. Therefore the database may contain inconsistencies (e.g. in early submissions) that were only detected and blocked in later submissions.
Quality element status (3rd, 2nd and 1st RBMP), by category#
The following dashboard shows the number of quality elements used in the assessment of the ecological status or potential:

Figure 68 Surface water bodies: Quality element status (3rd, 2nd and 1st RBMP), by category#
Number of quality elements used#
The following dashboard shows the number of quality elements used in the assessment of the ecological status or potential:
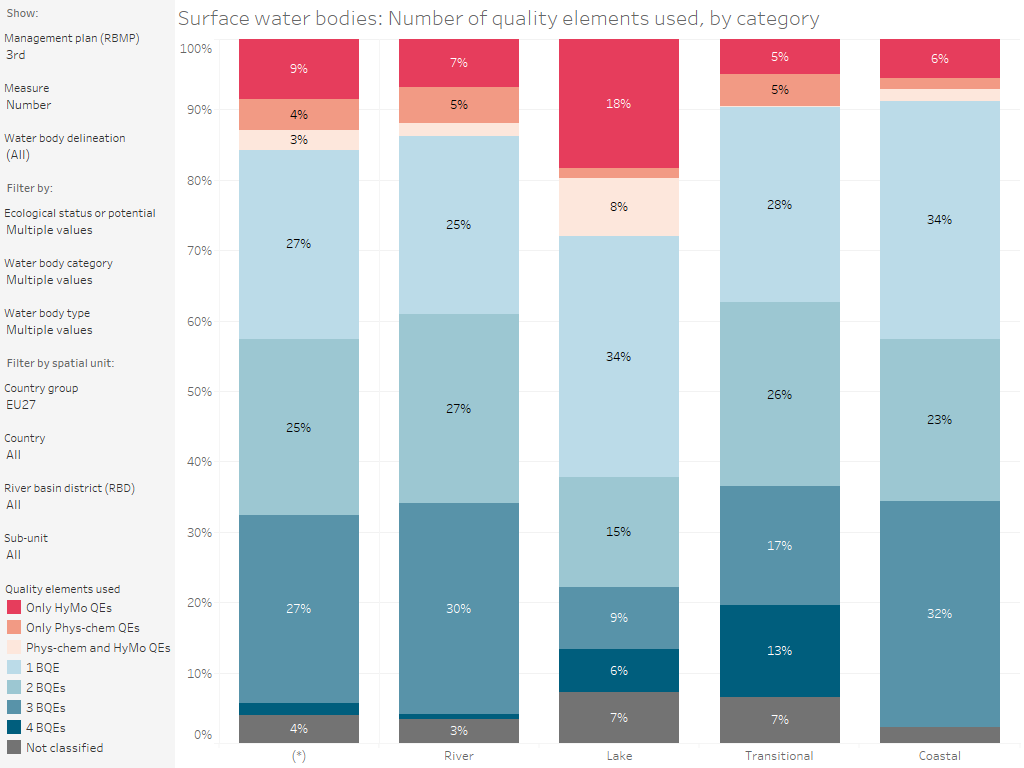
Figure 69 Surface water bodies: Number of quality elements used in the assessment of the ecological status or potential#
Status calculated from the quality elements#
The following dashboard shows the reported ecological status vs. calculated ecological status (based on the quality elements):
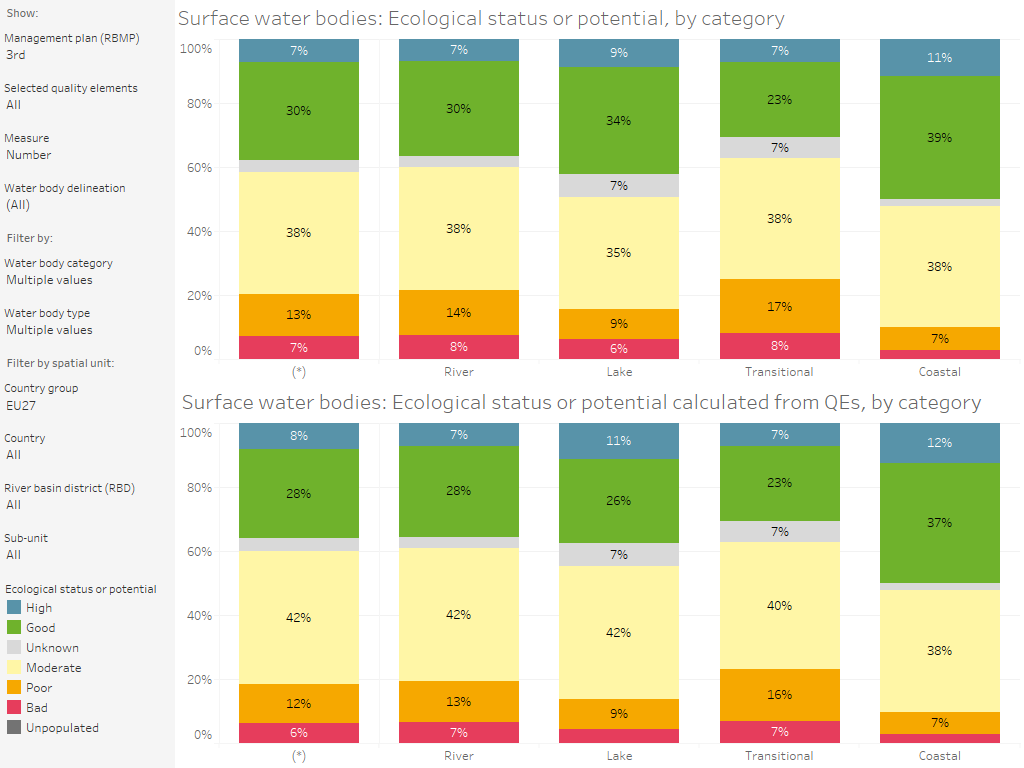
Figure 70 Surface water bodies: Ecological status or potential calculated from the quality elements, by category#
Quality element status#
In the 3rd cycle reporting, the quality element status value was reported using the following values:
‘1’ meaning ‘high’ status or potential
‘2’ meaning ‘good’ status or potential
‘Unknown’ meaning ‘unknown’ status or potential
“Not applicable” meaning the quality element is not applicable in the surface water category or water body national type to which the water body in question belongs.
For biological quality elements only, the following values were also used:
‘3’ meaning ‘moderate’ status or potential
‘4’ meaning ‘poor’ status or potential
‘5’ meaning ‘bad’ status or potential
For hydro-morphological and physico-chemical quality elements only, the following values were also used:
‘3’ meaning ‘less than good’ status or potential
“Monitored but not used” meaning than the QE was monitored but no standard has been developed and/or the QE is not used for status assessment
Show technical detail: encoding quality element status
To harmonise the data in different codelists and reporting cycles,
the reported values were recoded in the published [WISE_WFD].
Table 62
shows the original codes (id) and the published codes (mappingId).
tableName |
id |
label |
mappingTable |
mappingId |
|---|---|---|---|---|
QEStatusCode |
-1 |
Not a value(NULL). |
NilReasonType |
unpopulated |
QEStatusCode |
1 |
1 |
WFDStatus |
1 |
QEStatusCode |
2 |
2 |
WFDStatus |
2 |
QEStatusCode |
3 |
3 |
WFDStatus |
3 |
QEStatusCode |
4 |
4 |
WFDStatus |
4 |
QEStatusCode |
5 |
5 |
WFDStatus |
5 |
QEStatusCode |
6 |
MonitoredButNotUsed |
NilReasonType |
none |
QEStatusCode |
7 |
Unknown |
NilReasonType |
unknown |
QEStatusCode |
8 |
NotApplicable |
NilReasonType |
inapplicable |
“Monitored but not used”#
The option “Monitored but not used” was inherently ambiguous, because it could be applied to signify that the quality element was being monitored although it was in fact not applicable to a specific water category or water body national type.
Todo
The option “Monitored but not used” should be removed,
because it does not convey concrete information about the status.
Member States can report monitoring results
under the WISE-6 Water Quality dataflow:
that provides concrete information
about what is being monitored
beyond the requirements of the ecological status assessment.
“Not applicable”#
The 3rd cycle reporting guidance provided a clear definition of the option “Not applicable”.
If the QE is not applicable in the surface water category or type to which the water body in question belongs, then select ‘Not applicable’ from the enumeration list.
Theoretically, it should be possible to derive the applicability of the quality elements to a given type or category.
Show code: applicable QEs per water category or national type
 1-- https://discodata.eea.europa.eu/
 2SELECT  [countryCode]
 3      ,[surfaceWaterBodyCategory]
 4      ,[NCSWaterBodyType]
 5      ,[qeCode]
 6      ,MAX(IIF([qeStatusOrPotentialValue] IN ('1','2','3','4','5','unknown'),1,0)) AS qeApplicable
 7      ,MAX(IIF([qeStatusOrPotentialValue] IN ('inapplicable'),1,0)) AS qeInapplicable
 8  FROM [WISE_WFD].[v2r1].[SWB_SurfaceWaterBody_QualityElement] a
 9  WHERE a.[cYear] = 2022
10  AND a.[hasDescriptiveData] = 1
11  AND a.[qeCode] != 'QE3-3 - River Basin Specific Pollutants'
12  GROUP BY [countryCode]
13          ,[surfaceWaterBodyCategory]
14          ,[NCSWaterBodyType]
15          ,[qeCode]
16  -- uncomment the next two lines to identify reporting errors
17  -- HAVING MAX(IIF([qeStatusOrPotentialValue] IN ('1','2','3','4','5','unknown'),1,0)) = 1
18  --  AND MAX(IIF([qeStatusOrPotentialValue] IN ('inapplicable'),1,0)) = 1
19  ORDER BY [countryCode]
20          ,[surfaceWaterBodyCategory]
21          ,[NCSWaterBodyType]
22          ,[qeCode]
For 77% of the 3384 reported national types,
the applicability of the quality elements
can indeed be derived.
Unfortunately, for the remaining 772 national types
(23% of the total) the information is inconsistent,
and a given quality element is simultaneously reported
as applicable (because it has a reported status)
and not applicable to the assessment of ecological status.
It is possible that the inconsistencies are due to an interchangeable use or interpretation of the options ‘unknown’ and ‘inapplicable’, or are due to a mistake in the reporting of some water bodies only.
Nevertheless, the inconsistencies reveal a flaw in the reporting model, and an opportunity for both improvement and simplification. the applicability of the quality elements should be reported in the surface water methodologies and only the applicable quality elements should be reported in the quality elements table.
Proposed changes#
The removal of the options “Not applicable” and “Monitored but not used” reduces the reported data by 25% and provides a clearer and consistent overview of the assessment criteria.
qeStatusOrPotentialValue |
number of records |
% of records |
|---|---|---|
1,2,3,4,5 |
636,742 |
25% |
Unknown |
1,208,667 |
48% |
“Not applicable” |
541,637 |
21% |
“Monitored but not used” |
136,743 |
5% |
Todo
The applicability of the quality elements should be reported in the surface water methodologies and only the applicable quality elements should be reported in the quality elements table.
Ecological status and BQE status#
If a biological quality element fails to achieve ‘good’ or ‘high’ status, then the ecological status or potential cannot be ‘good’ or ‘high’.
The majority of reported data complies with this rule.
A total of 216 water bodies does not comply with this rule. The question is, can the reported ecological status or potential be ‘unknown’?
Show code
 1-- https://discodata.eea.europa.eu/
 2
 3SELECT a.[swEcologicalStatusOrPotentialValue]
 4    ,COUNT(DISTINCT
 5           IIF(a.[qeStatusOrPotentialValue] IN ('3','4','5'), [euSurfaceWaterBodyCode], NULL))
 6           AS wbWithFailingBQE
 7FROM  [WISE_WFD].[v2r1].[SWB_SurfaceWaterBody_QualityElement] a
 8WHERE a.[qeCode] LIKE 'QE1%'
 9  AND a.[cYear] = 2022
10  AND a.[hasDescriptiveData] = 1
11GROUP BY a.[swEcologicalStatusOrPotentialValue]
From a logical (mathematical) perspective, the ecological status can be ‘indeterminate’, if not all the relevant biological quality elements were assessed, and therefore it could be ‘moderate’, ‘poor’ or ‘bad’. But the ecological status is known to fail to achieve good status.
Furthermore, the analysis of the 216 water bodies shows that:
in 71 cases, the ecological status should have been reported as ‘bad’
in 69 cases, the ecological status could never be ‘moderate’.
worstBQE |
numberOfWB |
numberOfCountries |
|---|---|---|
3 |
76 |
5 |
4 |
69 |
3 |
5 |
71 |
3 |
216 |
5 |
The low frequency of these cases suggests a reporting error, that must be captured in the quality control during the 4th cycle.
Proposed change#
If at least one biological quality element has ‘moderate’, ‘poor’ or ‘bad’ status or potential, then the ecological status cannot be ‘unknown’.
Todo
If at least one biological quality element has ‘moderate’, ‘poor’ or ‘bad’ status or potential, then the ecological status cannot be ‘unknown’.
Clearer guidance must be provided to MS with regard to these cases.
The quality control must enforce the adopted guidance.
Show code
 1-- https://discodata.eea.europa.eu/
 2
 3SELECT a.[worstBQE]
 4      ,COUNT(DISTINCT a.[euSurfaceWaterBodyCode]) AS numberOfWB
 5      ,COUNT(DISTINCT a.[countryCode]) AS numberOfCountries
 6FROM
 7
 8  (SELECT a.[countryCode]
 9      ,a.[euSurfaceWaterBodyCode]
10      ,MAX(a.[qeStatusOrPotentialValue]) AS worstBQE
11      ,COUNT(DISTINCT a.[euSurfaceWaterBodyCode]) AS numberOfWB
12  FROM  [WISE_WFD].[v2r1].[SWB_SurfaceWaterBody_QualityElement] a
13  WHERE a.[qeCode] LIKE 'QE1%'
14  AND a.[qeStatusOrPotentialValue] IN ('3','4','5')
15  AND a.[swEcologicalStatusOrPotentialValue] IN ('Unknown')
16  AND a.[cYear] = 2022
17  AND a.[hasDescriptiveData] = 1
18  GROUP BY a.[countryCode],
19          a.[euSurfaceWaterBodyCode]
20  ) a
21GROUP BY ROLLUP(a.[worstBQE])
One-out-all-out: ecological status#
Todo
Include the CIS Guidance flowcharts for the ecological status assessment.
According to the WFD Annex V and as clarified in the CIS Guidance document 13, the ecological status is assessed using biological quality elements (QE1 a.k.a. BQE).
The physico-chemical quality elements (QE3) act as modifiers of the BQE assessment:
all applicable QE3 statuses must be ‘high’, for the ecological status to be ‘high’,
if any applicable QE3 status is ‘less than good’, then the ecological status cannot be ‘good’.
Likewise, the hydromorphological quality elements (QE2) act as modifiers of the BQE assessment:
all applicable QE2 statuses must be ‘high’, for the ecological status to be ‘high’,
if any applicable QE3 status is ‘less than good’, then the ecological status cannot be ‘good’.
In the 3rd cycle reporting, the quality control checks enforced the interpretation above. Pending: confirm whether if changes are required.
The hydromorphological quality elements
According to the 3rd cycle reporting guidance:
Rule 1: “If SWB/SurfaceWaterBody/swEcologicalStatusOrPotentialValue = 1 Then it cannot be lower than the highest of the values reported under SWB/SurfaceWaterBody/QualityElement/qeStatusOrPotentialValue”
Rule 2: “If SWB/SurfaceWaterBody/swEcologicalStatusOrPotentialValue in (2,3,4,5) Then it cannot be lower than the highest of the values reported under SWB/SurfaceWaterBody/QualityElement/qeStatusOrPotentialValue for the set of quality elements where qeCode starts with QE1 or qeCode starts with QE3.”
Rule 3: “If SWB/SurfaceWaterBody/swEcologicalStatusOrPotentialValue = 1 Then at least one hydromorphological quality element (QE2%) must be assessed.”
Rule 4: “If the surface water body has a known status (1,2,3,4 or 5) the status of all Quality Elements cannot be ‘Unknown’, ‘Not Applicable’ or ‘Monitored but not used’.”
Preliminary comments:
Rule 3 requires that a QE2 be assessed, but does not explicitly mention the QE2 status, which should also be taken into account.
Rule 4 requires that at least one QE be assessed, but it should also require that at least at least one QE1 be assessed.
According to the CIS Guidance documents, the QE2 status should also be assessed if the ecological status is ‘1’ and the worst QE3 status is also ‘1’.
According to the CIS Guidance documents, the QE2 status should also be assessed for the artificial and highly modified water bodies.
Checking the rule 2 (the ecological status cannot be worse than the worst QE1 or QE3):
As expected: 114204 surface water bodies with ecological status equal to the status of the worst known QE1 or QE3
NOT as expected: 309 surface water bodies with ecological status better than the status of the worst known QE1 or QE3. All the cases where due QE3-3 status (River Basin Specific Pollutants).
NOT as expected: 5665 surface water bodies with ecological status worse than the status of the worst known QE1 or QE3.
of which 1717 surface water bodies failing to achieve good ecological status, when none of the QE1 or or QE3 status is failing.
Repeating the analysis without ‘QE3-3 - River Basin Specific Pollutants’, the values are similar.
As expected: 112315 surface water bodies with ecological status equal to the status of the worst known QE1, QE3-1 or QE3-2
As expected: zero surface water bodies with ecological status better than the status of the worst known QE1, QE3-1 or QE3-2
NOT as expected: 7015 surface water bodies with ecological status worse than the status of the worst known QE1, QE3-1 or QE3-2
of which 2535 surface water bodies failing to achieve good ecological status, when none of the QE1, QE3-1 or QE3-2 status is failing
This raises the question of how to compare the ecological status reported in the 3rd cycle, with the ecological status that will be reported in the 4th cycle.
Deriving the ecological status from the reported quality elements statuses might somewhat reduce the problem (in the visualisations).
Show code
 1-- https://discodata.eea.europa.eu/
 2SELECT COUNT(DISTINCT IIF([swEcologicalStatusOrPotentialValue] = [worstQE1OrQE3Status], [euSurfaceWaterBodyCode], NULL)) AS numberOfWB_StatusEqualToWorstQE1OrQE3Status
 3  ,COUNT(DISTINCT IIF([swEcologicalStatusOrPotentialValue] < [worstQE1OrQE3Status], [euSurfaceWaterBodyCode], NULL)) AS numberOfWB_StatusBetterThanWorstQE1OrQE3Status
 4  ,COUNT(DISTINCT IIF([swEcologicalStatusOrPotentialValue] > [worstQE1OrQE3Status], [euSurfaceWaterBodyCode], NULL)) AS numberOfWB_StatusWorseThanWorstQE1OrQE3Status
 5  ,COUNT(DISTINCT IIF([swEcologicalStatusOrPotentialValue] IN ('3','4','5') AND [worstQE1OrQE3Status] NOT IN ('3','4','5'),[euSurfaceWaterBodyCode], NULL)) AS numberOfWB_StatusWorseThanGood
 6FROM
 7(SELECT a.[swEcologicalStatusOrPotentialValue]
 8      ,a.[euSurfaceWaterBodyCode]
 9      ,MAX(a.[qeStatusOrPotentialValue]) AS worstQE1OrQE3Status
10  FROM  [WISE_WFD].[v2r1].[SWB_SurfaceWaterBody_QualityElement] a
11  WHERE (a.[qeCode] LIKE 'QE1%' OR a.[qeCode] LIKE 'QE3-1%' OR a.[qeCode] LIKE 'QE3-2%')
12  AND a.[qeStatusOrPotentialValue] IN ('1','2','3','4','5')
13  AND a.[swEcologicalStatusOrPotentialValue] IN ('1','2','3','4','5')
14  --AND a.[naturalAWBHMWB] = 'Natural water body'
15  AND a.[cYear] = 2022
16  AND a.[hasDescriptiveData] = 1
17  GROUP BY a.[swEcologicalStatusOrPotentialValue]
18          ,a.[euSurfaceWaterBodyCode]) b
River basin specific pollutants#
According to the rules in the 3rd cycle of reporting,
if the status or potential of ‘QE3-3 - River Basin Specific Pollutants’
is less than good, than the failing RBSP must be reported.
This rule was enforced by the quality control.
Show code
 1-- https://discodata.eea.europa.eu/
 2SELECT a.[countryCode]
 3    ,a.[euRBDCode]
 4    ,a.[euSurfaceWaterBodyCode]
 5    ,a.[swEcologicalStatusOrPotentialValue]
 6    ,a.[swChemicalStatusValue]
 7    ,a.[qeCode]
 8    ,a.[qeStatusOrPotentialValue]
 9    ,b.[swFailingRBSP]
10FROM  [WISE_WFD].[v2r1].[SWB_SurfaceWaterBody_QualityElement] a
11LEFT JOIN [WISE_WFD].[v2r1].[SWB_SurfaceWaterBody_FailingRBSP] b
12ON a.[euSurfaceWaterBodyCode] = b.[euSurfaceWaterBodyCode]
13AND a.[cYear] = b.[cYear]
14WHERE a.[qeCode] = 'QE3-3 - River Basin Specific Pollutants'
15AND a.[qeStatusOrPotentialValue] = '3'
16AND a.[cYear] = 2022
17AND a.[hasDescriptiveData] = 1
18ORDER BY a.[countryCode]
19    ,a.[euRBDCode]
20    ,a.[euSurfaceWaterBodyCode]
21    ,a.[swEcologicalStatusOrPotentialValue]
The following table should that 2588 of those water bodies were reported as being in good or unknown chemical status. Incorporating the RBSPs into the chemical status assessment changes the percentage of water bodies not achieving good chemical status from 38% to 40%.
swChemicalStatusValue |
numberOfCountries |
numberOfWB |
numberOfRBSP |
|---|---|---|---|
2 |
18 |
2453 |
110 |
3 |
25 |
5192 |
167 |
Unknown |
10 |
135 |
21 |
Total |
25 |
7780 |
177 |
Show code
 1-- https://discodata.eea.europa.eu/
 2SELECT a.[swChemicalStatusValue]
 3  ,COUNT(DISTINCT a.[countryCode]) AS numberOfCountries
 4  ,COUNT(DISTINCT a.[euSurfaceWaterBodyCode]) AS numberOfWB
 5  ,COUNT(DISTINCT b.[swFailingRBSP]) AS numberOfRBSP
 6FROM  [WISE_WFD].[v2r1].[SWB_SurfaceWaterBody_QualityElement] a
 7LEFT JOIN [WISE_WFD].[v2r1].[SWB_SurfaceWaterBody_FailingRBSP] b
 8  ON a.[euSurfaceWaterBodyCode] = b.[euSurfaceWaterBodyCode]
 9  AND a.[cYear] = b.[cYear]
10WHERE a.[qeCode] = 'QE3-3 - River Basin Specific Pollutants'
11  AND a.[qeStatusOrPotentialValue] = '3'
12  AND a.[cYear] = 2022
13  AND a.[hasDescriptiveData] = 1
14GROUP BY a.[swChemicalStatusValue]
Heavily modified water bodies#
For 60% of the heavily modified water bodies, only one physical alteration and only one water use is reported. It doesn’t make sense to keep the two separate tables used in the 3rd cycle: it complicates the reporting and does not allow a link to be made between the alteration and the use.
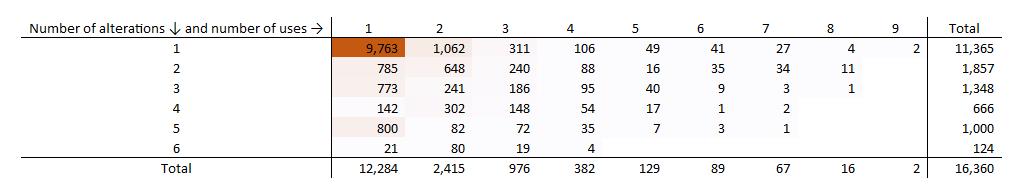
Figure 71 Heavily modified water bodies - Number of different physical alterations per water use.#
Show code
 1-- https://discodata.eea.europa.eu/
 2
 3SELECT
 4numberOfHMWBPhysicalAlteration,
 5numberOfHMWBWaterUse,
 6COUNT(DISTINCT [euSurfaceWaterBodyCode]) AS numberOfSurfaceWaterBodies
 7FROM
 8(SELECT [euSurfaceWaterBodyCode],
 9COUNT(DISTINCT [hmwbPhysicalAlteration]) AS numberOfHMWBPhysicalAlteration,
10COUNT(DISTINCT [hmwbWaterUse]) AS numberOfHMWBWaterUse
11FROM
12
13(  SELECT a.[euSurfaceWaterBodyCode]
14        ,a.[surfaceWaterBodyCategory]
15        ,a.[naturalAWBHMWB]
16        ,a.[hmwbPhysicalAlteration]
17        ,b.[hmwbWaterUse]
18    FROM [WISE_WFD].[v2r1].[SWB_SurfaceWaterBody_hmwbPhysicalAlteration] a
19    JOIN  [WISE_WFD].[v2r1].[SWB_SurfaceWaterBody_hmwbWaterUse] b
20    ON a.[euSurfaceWaterBodyCode] = b.[euSurfaceWaterBodyCode]
21    AND a.[cYear] = b.[cYear]
22    WHERE a.[hasDescriptiveData] = 1
23    AND a.[cYear] = 2022) AS a
24
25GROUP BY [euSurfaceWaterBodyCode]) AS b
26
27GROUP BY numberOfHMWBPhysicalAlteration, numberOfHMWBWaterUse
28ORDER BY numberOfHMWBPhysicalAlteration, numberOfHMWBWaterUse