
Economic analysis#
Last update: 2026-05-08
Warning
The online version of the text is being reviewed.
See PROPOSAL - Version 2026.02.20 PDF
Purpose and overview#
The document revises the Economic Analysis & Services classes used in the 3rd cycle of reporting of the Water Framework Directive River Basin Management Plans (Figure 23) and presents a proposal for the electronic reporting in the 4th cycle (Figure 24).
The former questionnaire in the EconomicAnalysis class is removed.
The questionnaire in the CostRecovery and CostRecoveryPerService tables maintains the same simplified Yes/No approach and requests information only for three collective services (drinking water supply services, irrigation water supply services and wastewater collection and treatment services).
The Service table is removed. Information about volumes, revenues and costs is requested in the VolumeRevenueCostPerService table, using the standard structure for statistical data commonly used by Eurostat.
        classDiagram
    direction TB

    class EconomicAnalysis {
        + updatedEconomicAnalysis: YesNoPartially_Union_Enum
        + economicAnalysisReference: ReferenceType [0..*]
        + costEffectiveness: CostEffectiveness_Enum
        + costEffectivenessReference: ReferenceType [0..*]
        + article9DrinkingWater: YesNoCode_Enum
        + article9Wastewater: YesNoCode_Enum
        + article9Irrigation: YesNoCode_Enum
        + article9SelfAbstraction: YesNoCode_Enum
        + article9WaterStorage: YesNoCode_Enum
        + article9FloodProtection: YesNoCode_Enum
        + article9Navigation: YesNoCode_Enum
        + article9Other: string1000
        + article94: YesNoCode_Enum
        + article94Reference: ReferenceType [0..*]
        + costRecoveryReference: ReferenceType [1..*]
    }

    class Service {
        + service: ServiceType_Enum
        + serviceOther: string1000 [0..1]
        + serviceCostInstrument: YesNoPartially_Union_Enum
        + serviceCostInstrumentReference: ReferenceType [0..*]
        + serviceVolumetricCharges: YesNoPartially_Union_Enum
        + servicePriceLevel: ThresholdType
        + serviceFinancialCostIncluded: YesNoPartially_Union_Enum
        + serviceFinancialCostCalculation: YesNoPartially_Union_Enum
        + serviceFinancialCostRecovery: NumberPercentageAboveType
        + serviceEnvironmentalCharge: YesNoCode_Enum
        + serviceEnvironmentalChargeScale: MSorRBD_Enum [0..1]
        + serviceEnvironmentalChargeRevenues: NumberDecimalType [0..1]
        + serviceEnvironmentalChargeRevenuesUse: YesNoPartially_Union_Enum [0..1]
        + serviceExternalEnvironmentalResourceCost: YesNoCode_Enum [0..1]
        + serviceExternalEnvironmentalResourceCostSignificance: YesNoCode_Enum [0..1]
        + serviceExternalEnvironmentalResourceCostInternalisation: YesNoPartially_Union_Enum [0..1]
        + serviceExternalEnvironmentalResourceCostJustification: string2500 [0..1]
        + serviceWaterUseHouseholds: YesNoCode_Enum
        + serviceWaterUseAgriculture: YesNoCode_Enum
        + serviceWaterUseIndustry: YesNoCode_Enum
        + serviceWaterUseOther: string1000 [0..1]
        + serviceWaterUseContribution: YesNoCode_Enum
    }

    class RBMPPoM {
        + countryCode: CountryCode_Enum
        + euRBDCode: FeatureUniqueEUCodeType
    }

    EconomicAnalysis --> RBMPPoM: 1..1
    Service --> RBMPPoM: 1..*
Figure 23 Partial class diagram for Economic Analysis and Water Services (RBMPPoM_2022) schema.#
        ---
config:
  class:
    hideEmptyMembersBox: true
  layout: dagre
  theme: neutral
---

classDiagram
    direction TB

    class CostRecovery {
        + euRBDCode: wiseIdentifier
        «adequate-contribution»
        + adequateContributionAccount: YesNo
        + adequateContributionSectoral: YesNo
        «polluter-pays-principle»
        + pppAccount: YesNo
        + pppERCBased: YesNo
        + pppTargetPolluters: YesNo
        «incentives»
        + incentivesAccount: YesNo
        + incentivesEmpiricalInformation: YesNo
        + incentivesDifferentiated: YesNo [0..1]
        + incentivesWaterScarcityUse: YesNo
    }

    class CostRecoveryPerService {
        + euRBDCode: wiseIdentifier
        + waterService: WFDWaterService
        «cost-recovery-principle-application»
        + costRecoveryFull: YesNoNotApplicable
        + costRecoveryCorroborated: YesNo [0..1]
        «Justification»
        + nationalMethodologyApplied: YesNo [0..1]
        + justificationLessFullRecovery: YesNo [0..1]
        + justificationFactor: string [0..1]
        + justificationSectoralInformation: YesNo [0..1]
        «Exemption»
        + article94Exemption: YesNo [0..1]
        + article94Justification: YesNo [0..1]
    }

    class VolumeRevenueCostPerService {
        + geo: wiseIdentifier
        + time: gYear
        + dimension: VolumeRevenueCost
        + obs_value: nonNegativeValue
        + obs_unit: UnitOfMeasure
        + obs_status: ObservationStatus [0..1]
        + obs_comment: string [0..1]
    }

classDef default fill:white,stroke:#000;
classDef forFixing fill:white,stroke:#f00;
Figure 24 Cost recovery questionnaire and volume, revenue and costs per service – 4th cycle of reporting#
Cost Recovery – 4th cycle#
The former questionnaire in the EconomicAnalysis class is removed.
The questionnaire in the CostRecovery and CostRecoveryPerService tables (Figure 25) maintains the same simplified Yes/No approach and requests information only for three collective services (drinking water supply services, irrigation water supply services and wastewater collection and treatment services).
Table 30 lists the content of the questionnaire.
Table |
Column |
Value / Question |
|---|---|---|
CostRecovery |
euRBDCode |
Identifier of the River Basin District |
adequateContributionAccount |
Is there an account of adequate contribution to service costs? |
|
adequateContributionSectoral |
Is such an account based on sectoral cost recovery rates? |
|
pppAccount |
Is there an account of the application of the Polluter Pays Principle (PPP)? |
|
pppERCBased |
Is the account based on estimates of Environmental & Resource Costs (ERC)? |
|
pppTargetPolluters |
Does the account describe how charges target relevant polluters? |
|
incentivesAccount |
Is there an account of adequate incentives of the pricing instruments? |
|
incentivesEmpiricalInformation |
Is the account based on empirical information on tariff schemes? |
|
incentivesDifferentiated |
If incentivesEmpiricalInformation = ‘Yes’, is the information differentiated over sectors or services? |
|
incentivesWaterScarcityUse |
Is there information on economic instruments used for water scarcity? |
|
CostRecoveryPerService |
euRBDCode |
Identifier of the River Basin District |
waterService |
Information is requested for each of the following services: |
|
costRecoveryFull |
Does the RBMP report whether cost recovery is (nearly) full? |
|
costRecoveryCorroborated |
Is the extent of cost recovery corroborated with rate calculations? |
|
nationalMethodologyApplied |
Is there a national methodology applied in these calculations? |
|
justificationCostRecovery |
If costRecoveryFull = ‘No’, is there a justification based on mitigation factors (Art 9(1))? |
|
justificationFactor |
If justificationCostRecovery = ‘Yes’, report the mitigation factors. |
|
justificationSectoralInfo |
If justificationCostRecovery = ‘Yes’, does this justification use sectoral information? |
|
article94Exemption |
Does the RBMP mention the ‘established practices’ exemption (Art 9(4))? |
|
article94Justification |
If article94Exemption = ‘Yes’, is there a justification for this exemption? |
        classDiagram
    direction TB

    namespace CostRecovery4thCycleOfReporting{
        class CostRecovery {
            + euRBDCode: wiseIdentifier
            «Adequate Contribution»
            + adequateContributionAccount: YesNo
            + adequateContributionSectoral: YesNo
            «Polluter Pays Principle»
            + pppAccount: YesNo
            + pppERCBased: YesNo
            + pppTargetPolluters: YesNo
            «Incentives»
            + incentivesAccount: YesNo
            + incentivesEmpiricalInformation: YesNo
            + incentivesDifferentiated: YesNo [0..1]
            + incentivesWaterScarcityUse: YesNo
        }
    }

    namespace CostRecoveryPerService4thCycleOfReporting{
        class CostRecoveryPerService {
            + euRBDCode: wiseIdentifier
            + waterService: WFDWaterService
            «Cost Recovery Principle Application»
            + costRecoveryFull: YesNoNotApplicable
            + costRecoveryCorroborated: YesNo [0..1]
            «Justification»
            + nationalMethodologyApplied: YesNo [0..1]
            + justificationLessFullRecovery: YesNo [0..1]
            + justificationFactor: string4000 [0..1]
            + justificationSectoralInformation: YesNo [0..1]
            «Exemption»
            + article94Exemption: YesNo [0..1]
            + article94Justification: YesNo [0..1]
        }
    }
Figure 25 CostRecovery – 4th cycle of reporting Figure 4 . CostRecoveryPerService – 4th cycle of reporting*#
Water Services Data – 4th cycle#
The data structure was simplified to a core set of quantitative data for a limited number of water services and water user sectors. The purpose is to obtain a consistent overview across Europe, at river basin district level.
Information is requested:
• about the physical volumes of water, the revenues and the costs (Figure 5),
• for three water user sectors – agriculture, industry and households (EconomicAnalysis_WaterSectors_4th_cycle _Table),
• and for three water services – public drinking water supply services, public irrigation water supply services and sewerage services.
a) |
b) and c) |
|---|---|
|
|
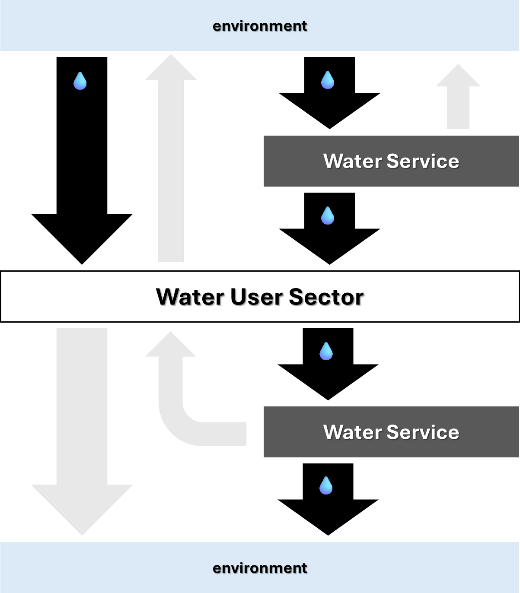
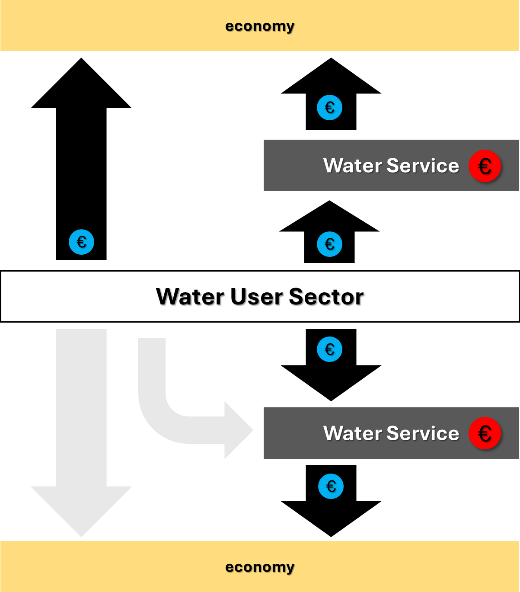
Figure 5.Overview diagram for the requested data on volumes, revenues and costs – 4th cycle of reporting.
a) Physical volume
The following flows are quantified: volume of water abstraction from the environment (e.g. for self‑supply and for public water supply), volume of water supplied by public water services, and volume of wastewater discharged to the environment by public water services.
The flows represented by grey arrows in the diagram are not required (water returned without use, e.g. due to evaporation or losses during transport, reused/recycled water supplied back to the water user sectors, direct discharges by the water user sectors).
Note that the gross freshwater abstraction includes only water abstracted from inland surface and groundwater bodies – desalinated water and water imports are not quantified. The requested data are the estimated average annual volumes in million cubic metres, over a specified reference period, in the river basin district.
b) Revenue
For the volumes identified in a), the revenues from water abstraction (e.g. from environmental charges paid to the general government institutional sector as resource taxes), revenues from water supply (e.g. from volumetric service fees paid to the Water collection, treatment and supply (NACE 36.00) sector), revenues from wastewater collection and treatment (for example, from volumetric service fees paid to the Sewerage (NACE 37.00) sector) and revenues from discharges to the environment, including emissions to water (for example, from environmental charges paid to the general government, which in this case may include pollution taxes).
The requested data are the estimated average annual total revenue in million units of the national currency, in the river basin district, for the volumes quantified in a).
c) Cost
For the provision of the services quantified in a) and b), the total costs are to be quantified, distinguishing between CAPEX and OPEX.
The requested data on water volumes is detailed in (Figure 26). The relevant concepts are aligned with the OECconceptualvolumeD/Eurostat Joint Questionnaire on Inland Waters and the Eurostat Regional Water Questionnaire and defined in Table 33.
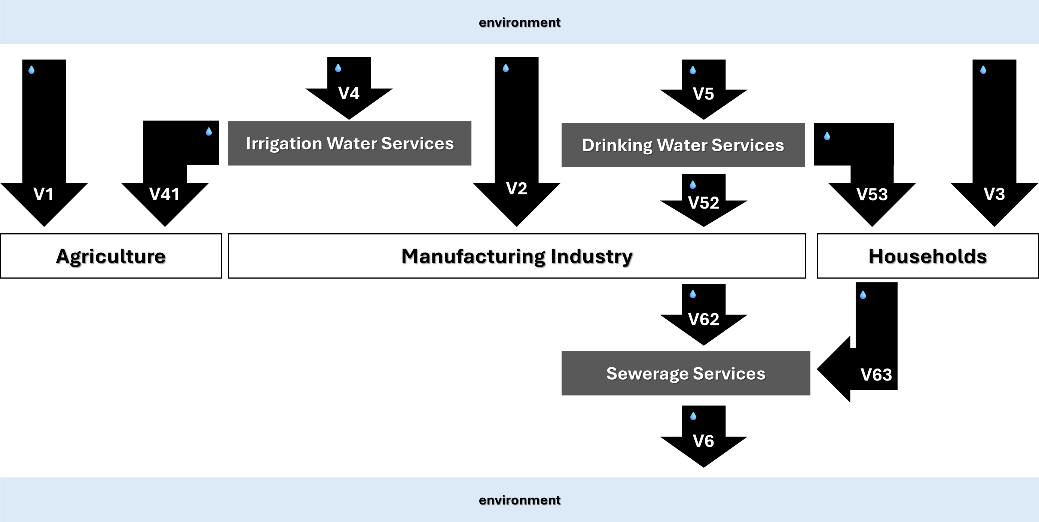
Figure 26 Conceptual diagram for the requested data on volumes – 4th cycle of reporting.#
Water user sector |
Definition |
Notes |
|---|---|---|
AGRICULTURE |
Includes: |
|
MANUFACTURING INDUSTRY |
Includes: |
By definition, the volume of water abstraction by the MANUFACTURING INDUSTRY (NACE 10–33) sector for self‑supply excludes water abstraction by NACE 36 entities. |
HOUSEHOLDS |
Aligned with the OECD/Eurostat Joint Questionnaire on Inland Waters, the term “Households” refers to the resident population as final users of supplied water and generators of domestic wastewater. |
Water service |
Definition |
Notes |
|---|---|---|
DRINKING WATER SERVICE |
Water supplied by economic units engaged in collection, purification and distribution of water, i.e. under NACE Code 36.00 (Water collection, treatment and supply). |
For the purposes of the 4th cycle of electronic reporting, note the restriction to “drinking water supply”. |
IRRIGATION WATER SERVICE |
Same as above. |
For the purposes of the 4th cycle of electronic reporting, note the restriction to “irrigation water supply”. |
SEWERAGE SERVICE |
Wastewater collection, treatment and discharge services provided by economic units under NACE Code 37.00 (Sewerage). |
For the purposes of the 4th cycle of electronic reporting, note the restriction to the treatment of urban wastewater. |
All the information is requested at river basin district level and must refer to the same reference year, preferably close to the programming period.
The following generic guidelines apply to the reporting of volumes:
• Volumes related to water abstraction (V1, V2, V3, V4, V5 in Figure 26) are reported based on the location of the point of abstraction. Only abstractions from freshwater surface water bodies (rivers and lakes, including reservoirs) and groundwater bodies are considered.
• Volumes related to water use (V41, V52, V53 in Figure 26) are reported based on the location of the point of use/consumption. In other words, the volumes refer to water used in the river basin district.
• Volumes related to water returns (V6 in Figure 26) are reported based on the location of the point of wastewater discharge. This includes discharges also to transitional and coastal water bodies located in the river basin district.
Given the guidelines above, and the fact that the data is requested at river basin district level (RBD), the following corollaries apply:
• The balance condition V4 ≈ V41 is not expected to hold, due to losses during transport and water returned without use (which result in V4 > V41) or due to transfers between river basin districts (which may result in V41 > V4).
• The balance condition V5 ≈ V52 + V53 is not expected to hold, again due to losses and transfers between river basin districts, including the cases where the user/consumer is outside the river basin district where the water is abstracted.
• Note that V62 and V63 refer to the volume of wastewater collected and treated by the sanitary services, and not to the amount of wastewater generated by the manufacturing industry and household sectors. Note also that the condition V62 + V63 ⪅ V6 is expected to hold, because V62 and V63 represent a partial apportionment of V6, i.e. of the total volume of treated effluents discharged in the river basin district. The equality V62 + V63 ≈ V6 is not expected to hold (it would only hold if the contribution both of urban run‑off and wastewater from other water user sectors were negligible).
• Finally, the condition V52 + V53 ≈ V62 + V63 is not expected to hold if the discharges include a significant amount of wastewater collected from users located outside the basin.
Diagram |
Concept |
Relevant concepts |
Notes |
|---|---|---|---|
V1, V2, V3 |
Water abstraction – for self‑supply |
“Self‑supply” refers to the abstraction of water directly by the user for their own final use, rather than obtaining water from a public water supplier or another user. |
The volumes are reported in the river basin district where the point of abstraction is located. |
V4 |
Water abstraction – for other water supply - irrigation water |
Volume of water abstracted for the purpose of collective irrigation water supply. |
The volumes are reported in the river basin district where the point of abstraction is located. |
V41 |
Water use – from other water supply - irrigation water |
To maintain alignment with the OECD/Eurostat Joint Questionnaire, “Other water supply - irrigation water” refers to the portion of water supplied to agriculture that is not counted under either “self‑supply” or “public water supply.” |
The volumes are reported in the river basin district where the point of use/consumption is located. |
V5 |
Water abstraction – for public water supply - drinking water |
Volume of water abstracted for the purpose of collective drinking water supply. |
The volumes are reported in the river basin district where the point of abstraction is located. |
V52, V53 |
Water use – from public water supply - drinking water |
Water supplied by economic units engaged in collection, purification and distribution of water. |
Note that the desalination of marine water to produce water as the principal product is included in the Public Water Supply definition and reporting under the OECD/Eurostat Joint Questionnaire (see ABS_PWS). However, for the 4th cycle of electronic reporting under the WFD, the volumes reported for ‘Water use - from public water supply - drinking water’ (see V52 and V53) do not include desalinated water. |
V6 |
Water returns – Discharge of treated effluents |
The volume of wastewater that has undergone a treatment process in an urban wastewater treatment plant (UWWTP) and is subsequently released back into the environment — typically into rivers, lakes, transitional waters, coastal waters, or infiltrated into the soil or groundwater. |
The volumes are reported in the river basin district where the point of discharge is located. |
V62, V63 |
Sewerage – Collection and treatment of wastewater |
See Table 15 for the definition of the water user sector Manufacturing Industry (for V62) and Households (for V63). |
The volumes are reported as an apportionment of the volume of treated effluents discharged in the river basin district. |
Adapted from: Eurostat & OECD. (2024). Data Collection Manual for the OECD/Eurostat Joint Questionnaire on Inland Waters and Eurostat Regional Water Questionnaire (Version 5). Eurostat.
The requested data on revenues is detailed in Figure 27. The information must refer to the same year and to the same totals reported for the volumes of water.
The following generic guidelines apply to the reporting of revenues:
• Water abstraction revenues (R1, R2, R3, R4, R5 in Figure 27) must include all environmental/resource taxes and administrative fees paid (directly or indirectly) to the general government.
• Water supply revenues (R41, R52, R53 in Figure 27) represent the gross revenue of the irrigation water service providers and the drinking water service providers from fees charged to the end‑user sector (agriculture, manufacturing industry and households). The gross revenue must include the base service fee plus any environmental or resource costs incurred during abstraction that are passed through to the consumer to ensure an adequate contribution from that sector.
• Wastewater discharges revenues (R6 in Figure 27) must include all environmental taxes and pollution levies paid directly or indirectly to the government for the emission of pollutants back into the environment.
• Sewerage services revenues (R62 and R63 in Figure 27) represent gross revenue for wastewater collection and treatment services. The revenue must include the service fees charged to users plus any internalised environmental charges related to the final discharge that are passed on to the households or industrial users.
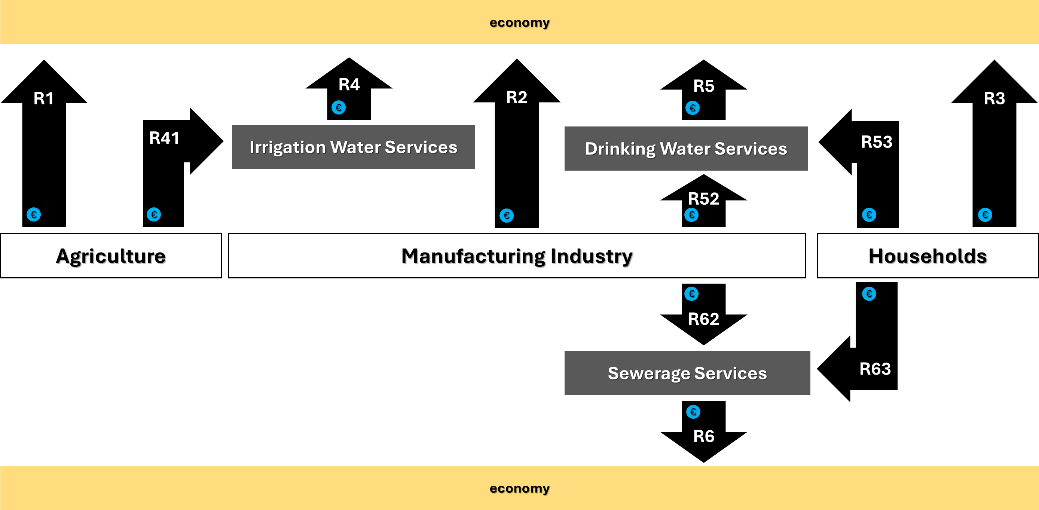
Figure 27 Conceptual diagram for the requested data on revenues – 4th cycle of reporting.#
Regarding the costs, the data is again requested for the same year for which volumes and revenues are reported. The total costs, OPEX and CAPEX should be reported for each of the three services in Figure 27, as well as the estimated global cost recovery rate.
The following generic guidelines apply to the reporting of costs:
• Grant‑financed assets should be included in capital expenditure (CAPEX) estimates for the water service that acquires and owns the asset, and regardless of the source of funding ([1]).
• Environmental taxes should be included in the current expenditure (OPEX) estimates for the water services ([2]).
Figure 28 presents the standardised structure for the reporting of volumes, revenues and costs per water service. Volumes must be reported in million cubic metre, revenues and costs must be reported in million units of national currency (except for the cost recovery rate, which is reported as a percentage).
The dimension codes for the reporting of costs per water service are presented in Table 34.
The dimension codes for the reporting of volumes and revenues are presented in Table 35.
        ---
config:
  class:
    hideEmptyMembersBox: true
  layout: dagre
  theme: neutral
---
classDiagram
    direction TB

    class VolumeRevenueCostPerService {
        + geo: wiseIdentifier
        + time: gYear
        + dimension: VolumeRevenueCost
        + obs_value: nonNegativeValue
        + obs_unit: UnitOfMeasure
        + obs_status: ObservationStatus [0..1]
        + obs_comment: string4000 [0..1]
    }

classDef default fill:white,stroke:#000;
classDef forFixing fill:white,stroke:#f00;
Figure 28 Reporting of volume, revenue and costs per water service – 4th cycle of reporting#
See also in ([3])
Dimension |
Description |
|---|---|
CST_IRR_TOT |
Irrigation water services – Total cost |
CST_IRR_CAP |
Irrigation water services – Capital expenditure |
CST_IRR_OPE |
Irrigation water services – Operational expenditure |
CST_IRR_CRR |
Irrigation water services – Cost recovery rate |
CST_DRI_TOT |
Drinking water services – Total cost |
CST_DRI_CAP |
Drinking water services – Capital expenditure |
CST_DRI_OPE |
Drinking water services – Operational expenditure |
CST_DRI_CRR |
Drinking water services – Cost recovery rate |
CST_WWT_TOT |
Sewerage services – Total cost |
CST_WWT_CAP |
Sewerage services – Capital expenditure |
CST_WWT_OPE |
Sewerage services – Operational expenditure |
CST_WWT_CRR |
Sewerage services – Cost recovery rate |
Diagram |
Dimension |
Description |
From |
To |
|---|---|---|---|---|
V1 |
VOL_ABS_SS_AGR_IR |
Volume – Water abstraction – self‑supply for the agriculture sector |
Environment (inland waters) |
Agriculture (NACE 01) |
V2 |
VOL_ABS_SS_IND_C |
Volume – Water abstraction – for self‑supply for the manufacturing industry sector |
Environment (inland waters) |
Manufacturing industry (NACE 10–33) |
V3 |
VOL_ABS_SS_HH |
Volume – Water abstraction – for self‑supply for households |
Environment (inland waters) |
Households |
V4 |
VOL_ABS_OS_AGR_IR |
Volume – Water abstraction – for other water supply of irrigation water |
Environment (inland waters) |
Water collection, treatment and supply (NACE 36) |
V5 |
VOL_ABS_PWS_DRI |
Volume – Water abstraction – for public water supply of drinking water |
Environment (inland waters) |
Water collection, treatment and supply (NACE 36) |
V41 |
VOL_USE_OS_AGR_IR |
Volume – Water use – for other water supply of irrigation water |
Water collection, treatment and supply (NACE 36) |
Agriculture (NACE 01) |
V52 |
VOL_USE_PWS_DRI_IND_C |
Volume – Water use – from public water supply of drinking water to the manufacturing industry sector |
Water collection, treatment and supply (NACE 36) |
Manufacturing industry (NACE 10–33) |
V53 |
VOL_USE_PWS_DRI_HH |
Volume – Water use – from public water supply of drinking water to households |
Water collection, treatment and supply (NACE 36) |
Households |
V62 |
VOL_WWT_IND_C |
Volume – Sewerage – Collection and treatment of wastewater from the manufacturing industry |
Manufacturing industry (NACE 10–33) |
Sewerage (NACE 37) |
V63 |
VOL_WWT_HH |
Volume – Sewerage – Collection and treatment of wastewater from households |
Households |
Sewerage (NACE 37) |
V6 |
VOL_DIS_TWW |
Volume – Water returns – Discharge of treated effluents |
Sewerage (NACE 37) |
Environment |
R1 |
REV_ABS_SS_AGR_IR |
Revenue – Water abstraction – from self‑supply for the agriculture sector |
Agriculture (NACE 01) |
General government* |
R2 |
REV_ABS_SS_IND_C |
Revenue – Water abstraction – from self‑supply for the manufacturing industry sector |
Manufacturing industry (NACE 10–33) |
General government* |
R3 |
REV_ABS_SS_HH |
Revenue – Water abstraction – from self‑supply for households |
Households |
General government* |
R4 |
REV_ABS_OS_AGR_IR |
Revenue – Water abstraction – from other water supply of irrigation water |
Water collection, treatment and supply (NACE 36) |
General government* |
R5 |
REV_ABS_PWS_DRI |
Revenue – Water abstraction – from public water supply of drinking water |
Water collection, treatment and supply (NACE 36) |
General government* |
R41 |
REV_USE_OS_AGR_IR |
Revenue – Water use – from other water supply of irrigation water |
Agriculture (NACE 01) |
Water collection, treatment and supply (NACE 36) |
R52 |
REV_USE_PWS_DRI_IND_C |
Revenue – Water use – from public water supply of drinking water to the manufacturing industry sector |
Manufacturing industry (NACE 10–33) |
Water collection, treatment and supply (NACE 36) |
R53 |
REV_USE_PWS_DRI_HH |
Revenue – Water use – from public water supply of drinking water to households |
Households |
Water collection, treatment and supply (NACE 36) |
R62 |
REV_WWT_IND_C |
Revenue – Sewerage – from collection and treatment of wastewater from the manufacturing industry |
Manufacturing industry (NACE 10–33) |
Sewerage (NACE 37) |
R63 |
REV_WWT_HH |
Revenue – Sewerage – from collection and treatment of wastewater from households |
Households |
Sewerage (NACE 37) |
R6 |
REV_DIS_TWW |
Revenue – Water returns – Discharge of treated effluents |
Sewerage (NACE 37) |
General government* |
Includes both direct and indirect payments to the general government institutional sector. May also include payments to private sector owners.
Ancillary Data Sources#
Information about annual volumes is reported voluntarily by MS under the OECD/Eurostat Joint Questionnaire on Inland Waters and Eurostat Regional Water Questionnaire ([4],[5]). Although the questionnaires have a much higher level of detail than required for the 4th cycle of electronic reporting, it is important that MS provide consistent data, which may allow more detailed analysis to be performed if necessary.
Tables Table 36,Table 37,Table 38 provides an overview of some of the OECD/Eurostat Joint Questionnaire tables and dimensions that are directly related to the data requested for the WFD 4th cycle of reporting.
Overview of relevant tables and dimensions in the OECD/Eurostat Joint Questionnaire.
Dimension 1 |
Dimension 2 |
Description |
|---|---|---|
FSW |
ABST |
1. Fresh surface water total gross abstraction (NACE 01–99) |
FSW |
ABS_PWS |
by Public water supply |
FSW |
ABS_AGR |
by Agriculture, forestry, fishing (NACE 01–03) |
FSW |
ABS_AGR_IR |
of which for irrigation |
FSW |
ABS_IND |
by Manufacturing industry (NACE 10–33) |
FSW |
ABS_HH |
by Private households |
FGW |
ABST |
2. Fresh groundwater total gross abstraction (NACE 01–99) |
FGW |
ABS_PWS |
by Public water supply |
FGW |
ABS_AGR |
by Agriculture, forestry, fishing (NACE 01–03) |
FGW |
ABS_AGR_IR |
of which for irrigation |
FGW |
ABS_IND |
by Manufacturing industry (NACE 10–33) |
FGW |
ABS_HH |
by Private households |
Dimension 1 |
Dimension 2 |
Description |
|---|---|---|
PWS |
TOTAL_HH |
1. Public water supply – TOTAL (NACE 01–99) |
PWS |
A |
Agriculture, forestry, fishing (NACE 01–03) |
PWS |
C |
– Manufacturing industry (NACE 10–33) |
PWS |
EP_HH |
Private households |
SOWS |
TOTAL_HH |
2. Self and other water supply – TOTAL (NACE 01–99) |
SOWS |
A |
Agriculture, forestry, fishing (NACE 01–03) |
SOWS |
C |
– Manufacturing industry (NACE 10–33) |
SOWS |
EP_HH |
Private households |
Dimension 1 |
Dimension 2 |
Description |
|---|---|---|
VOL_WW |
GEN_PS |
GENERATION OF WASTEWATER – POINT SOURCES – Total (NACE 01–99) |
VOL_WW |
GEN_AGR |
Agriculture, forestry, fishing (NACE 01–03) |
VOL_WW |
GEN_IND |
Industry – total (NACE 05–43) |
VOL_WW |
GEN_MAN |
– Manufacturing industry (NACE 10–33) |
VOL_WW |
GEN_DOM |
Domestic sources – total |
VOL_WW |
GEN_HH |
– Private households |
VOL_WW |
GEN_URB |
Urban wastewater – total generated |
VOL_WW |
TRT_URB_IF |
– Treatment in WWTPs – total inflow |
VOL_WW |
GEN_IND_XURB |
Industrial wastewater (not part of Urban WWV) – total generated |
VOL_WW |
DIS_IND_IW |
– Discharges to inland waters – Total |
VOL_WW |
DIS_IND_IW_AT |
of which: Discharges to inland waters after treatment |
VOL_WW |
DIS_IND_IW_NT |
of which: Discharges to inland waters without treatment |
VOL_WW |
DIS |
Total discharges of WWTPs (urban and other) – after treatment |
        classDiagram
    direction TB

    class VolumeRevenueCostPerService {
        + euRBDCode: wiseIdentifier
        + phenomenonTimePeriod: gYear
        + observedProperty: VolumeRevenueCost
        + resultObservedValue: nonNegativeValue
        + resultUnit: UnitOfMeasure
        + resultObservationStatus: ObservationStatusCode [0..1]
        + remarks: string4000 [0..1]
    }
Figure 29 Reporting of volume, revenue and costs per water service – 4th cycle of reporting - SDMX#