Focus on cities
These applications provide air quality information specifically for European cities, including pollutant concentrations, population exposure and comparative assessments of urban air quality.
Air quality in cities
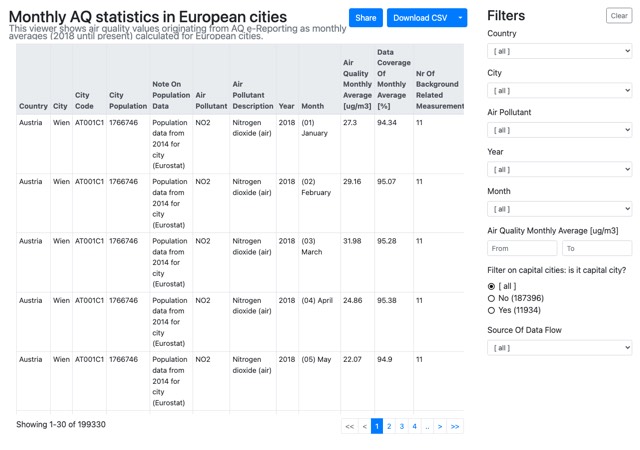
Monthly air quality statistics Explore monthly average concentrations calculated for European cities from AQ e-Reporting data (2018 onwards). |
Click the image to open the interactive viewer. |
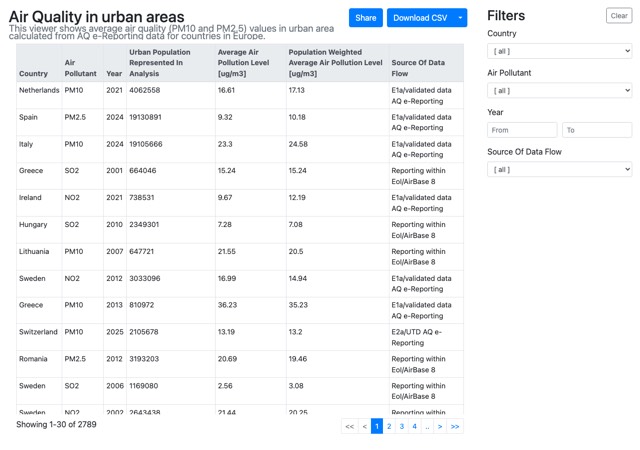
Annual air quality in urban areas Review annual average PM₁₀ and PM₂.₅ concentrations in urban areas across European countries based on AQ e-Reporting data. |
Click the image to open the interactive viewer. |
Population exposure
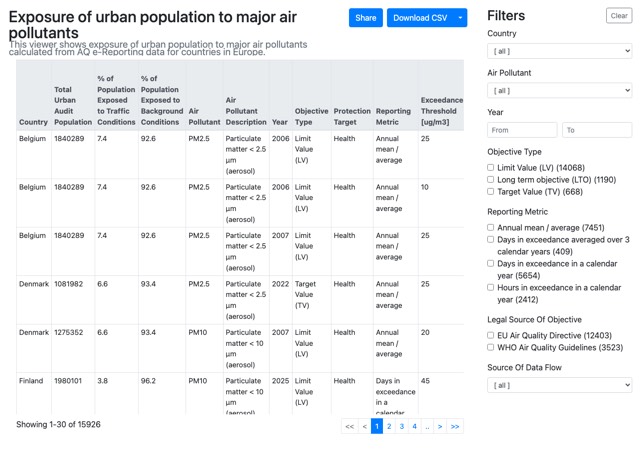
Population exposed to air pollution Analyse the proportion of the urban population exposed to NO₂, O₃, PM₂.₅ and PM₁₀ concentrations above selected European air quality standards. |
Click the image to open the interactive viewer. |
European city air quality viewer
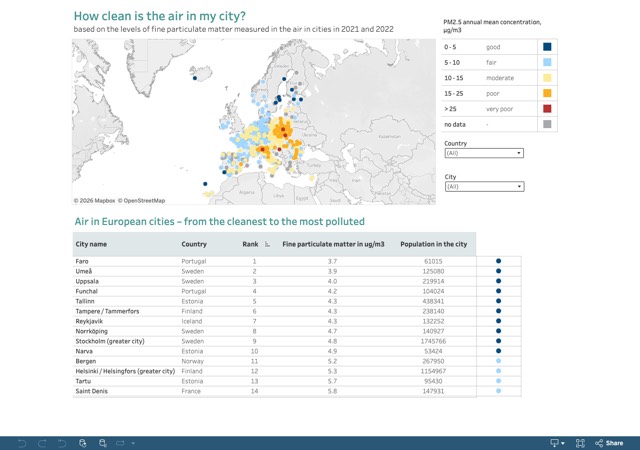
European city air quality viewer Compare more than 700 European cities according to long-term exposure to PM₂.₅, NO₂ and O₃. The ranking is based on population-weighted concentrations derived from high-resolution air quality maps together with concentration-response functions recommended by the World Health Organization. This application was previously known as the City Ranking Viewer. |
Click the image to open the interactive viewer. |