Data flow monitors
Use these applications to follow the submission and processing of air quality data, verify calculated aggregations and review the continuity of reported time series.
Validated data — E1a and other data flows
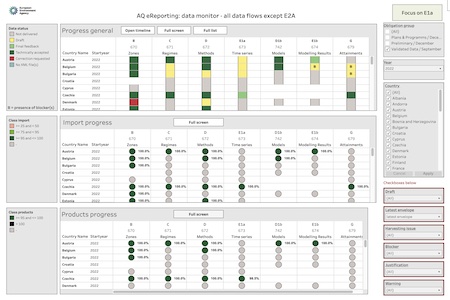
Monitor all data flows except E2a Follow the processing of all air quality data flows except provisional E2a data. The viewer provides an overview of submission and processing status across the different reporting data flows. |
Click the image to open the interactive viewer. |
Aggregations and continuity on E1a Verify the aggregations calculated by the EEA from validated E1a data and review the continuity of reported time series across reporting years. |
Click the image to open the interactive viewer. |
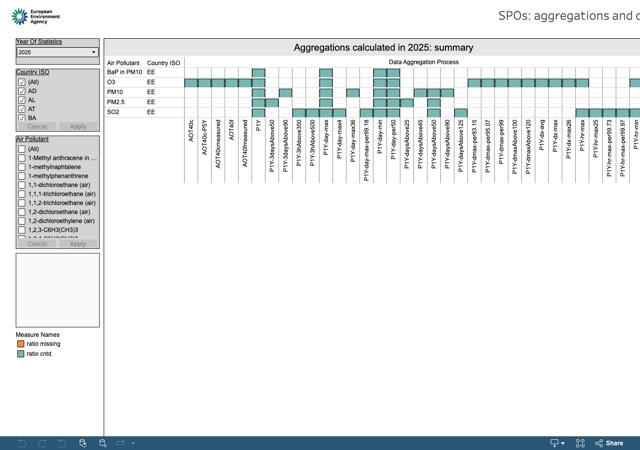
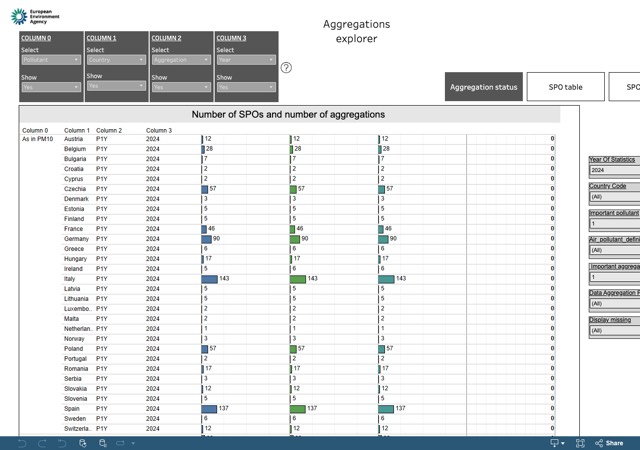
Aggregations explorer The Aggregations Explorer is intended to replace the Aggregations and continuity on E1a viewer. It provides the same core information through a more user-friendly interface and offers greater flexibility for selecting dimensions and displaying additional features. |
Click the image to open the interactive viewer. |
Provisional data — E2a
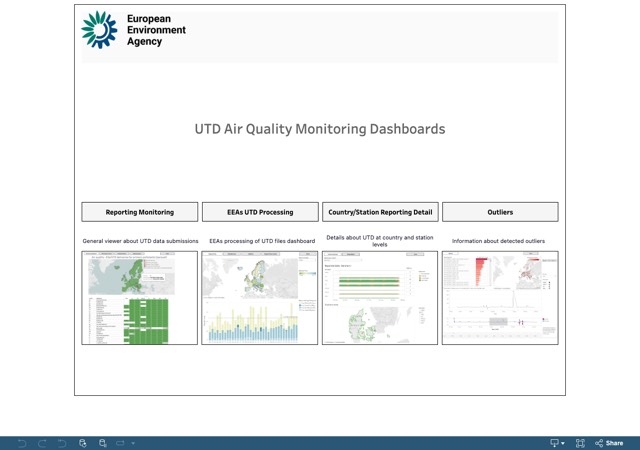
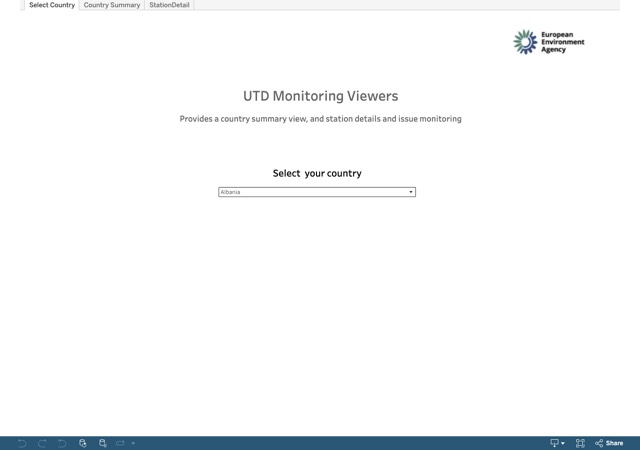
UTD Submission Monitoring Dashboards This viewer combines three dashboards covering the overall status of UTD data submissions, country- and station-level details, and the EEA processing of submitted files. It replaces and upgrades the previous UTD submission: general and UTD submission: country and station level viewers. |
Click the image to open the interactive viewer. |
Monitor UTD processing Review detailed information on the processing of provisional E2a data, including the timelag between measurement and data availability. |
Click the image to open the interactive viewer. |