Data tables
Use these applications to consult information reported through the different AQ e-Reporting data flows and the annual statistics calculated from validated air quality data.
Data flow B — air quality zones
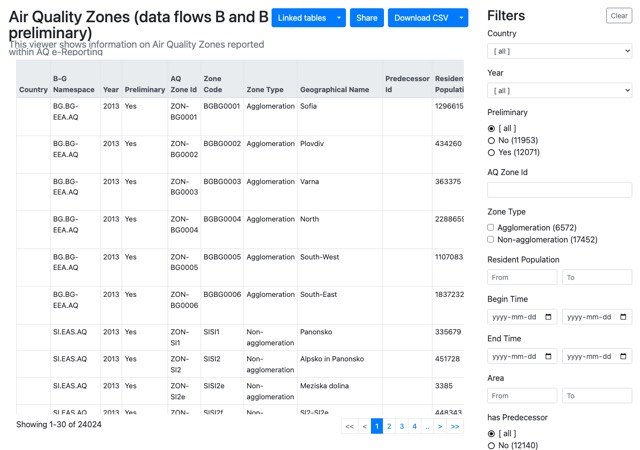
Air quality zones Consult information on the air quality zones reported through data flow B and preliminary data flow B. |
Click the image to open the interactive viewer. |
Data flow C — assessment regimes
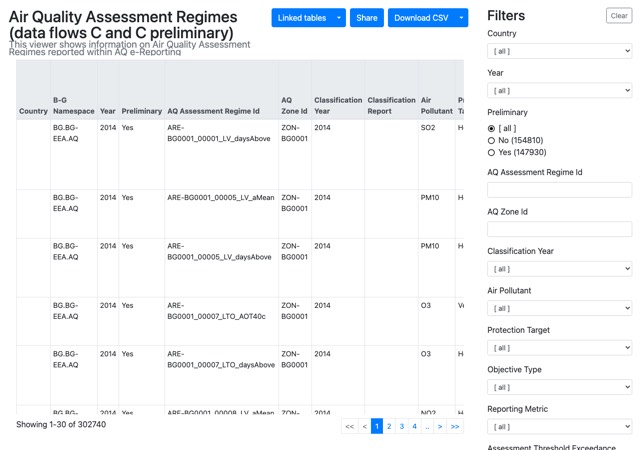
Air quality assessment regimes Consult information on the assessment regimes reported through data flow C and preliminary data flow C. |
Click the image to open the interactive viewer. |
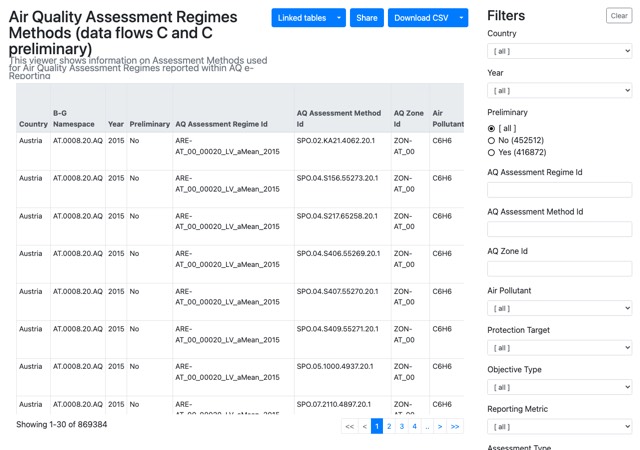
Assessment regime methods Consult information on the methods associated with air quality assessment regimes reported through data flow C and preliminary data flow C. |
Click the image to open the interactive viewer. |
Data flows D, D1b and E1b — assessment methods
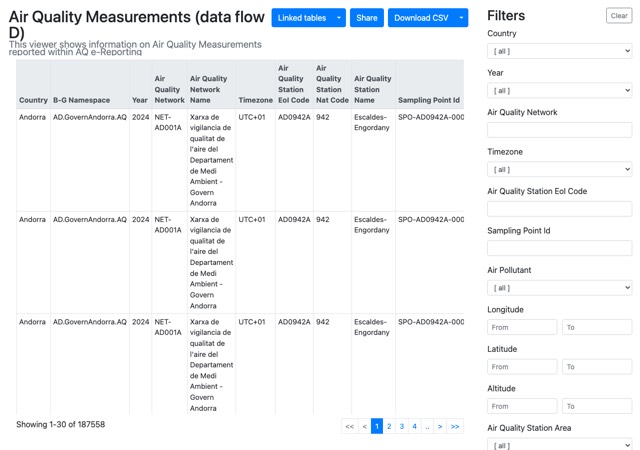
Measurement stations Consult information on air quality measurement stations reported through data flow D. |
Click the image to open the interactive viewer. |
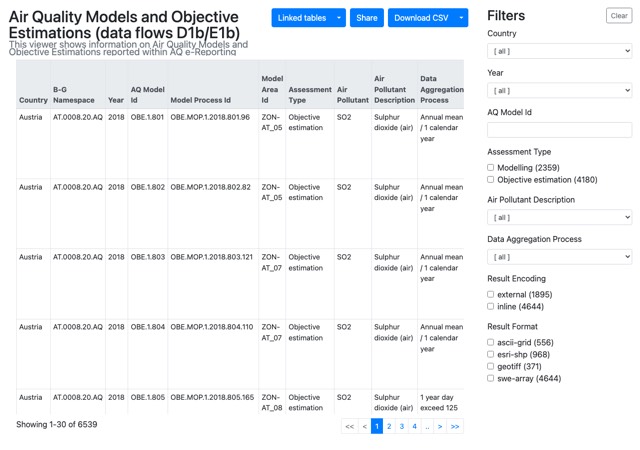
Models and objective estimations Consult information on models and objective estimations reported through data flows D1b and E1b. |
Click the image to open the interactive viewer. |
Data flow E1a — annual statistics
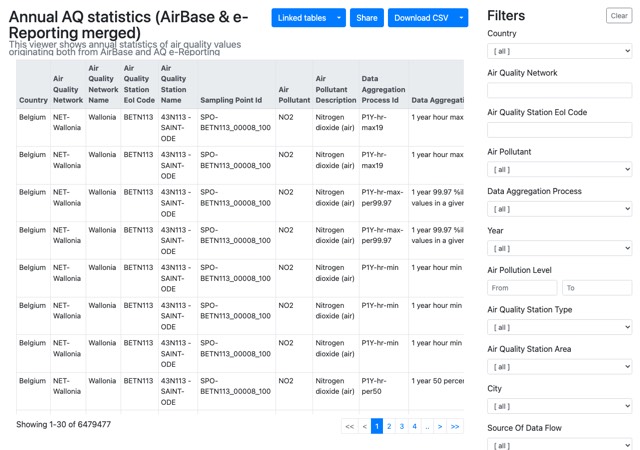
Annual air quality statistics Consult annual statistics calculated from validated air quality measurements originating from AirBase and AQ e-Reporting data flow E1a. |
Click the image to open the interactive viewer. |
Data flow G — attainment
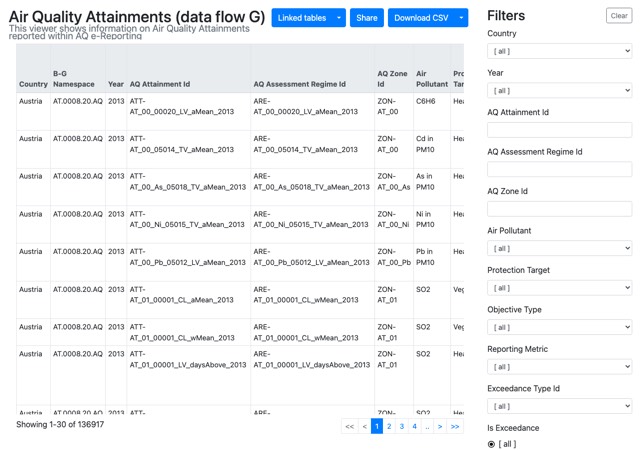
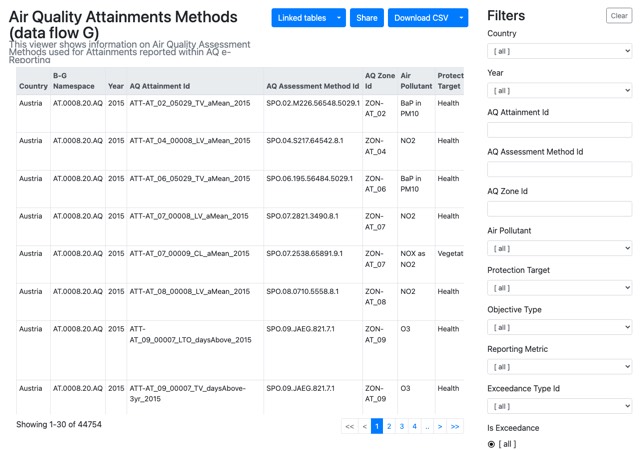
Attainment status Consult information on the attainment status reported through data flow G. |
Click the image to open the interactive viewer. |
Attainment assessment methods Consult information on the assessment methods used to establish attainment status and reported through data flow G. |
Click the image to open the interactive viewer. |
Data flow H — air quality plans
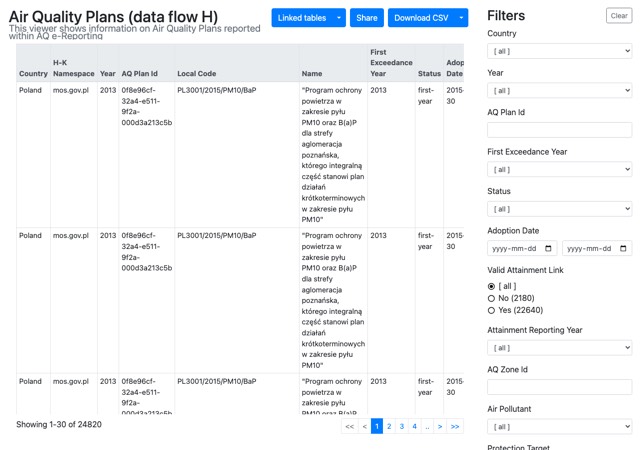
Air quality plans Consult information on air quality plans reported through data flow H. |
Click the image to open the interactive viewer. |
Data flow I — source apportionment
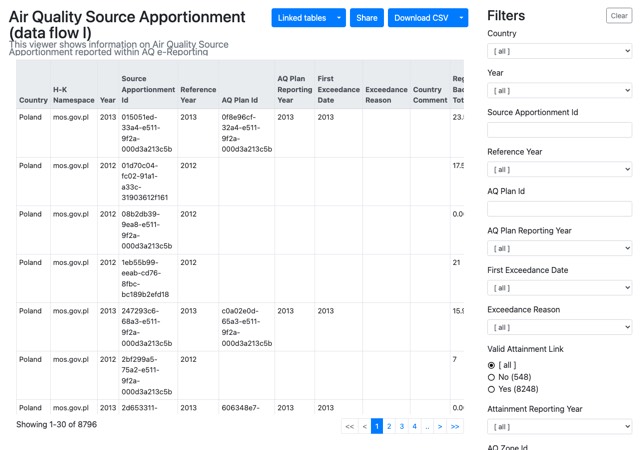
Source apportionment Consult information on air quality source apportionment reported through data flow I. |
Click the image to open the interactive viewer. |
Data flow J — scenarios
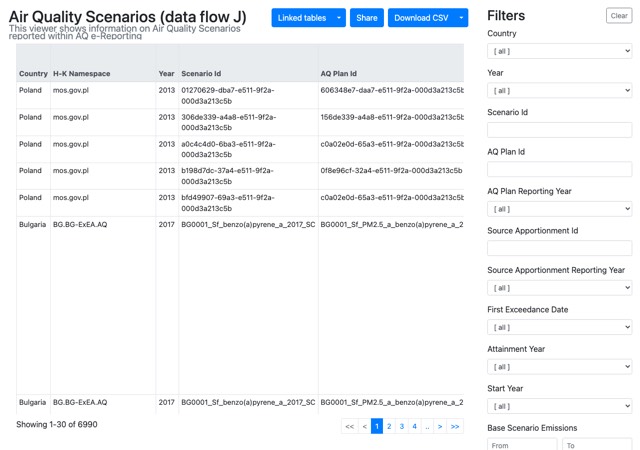
Air quality scenarios Consult information on air quality scenarios reported through data flow J. |
Click the image to open the interactive viewer. |
Data flow K — measures
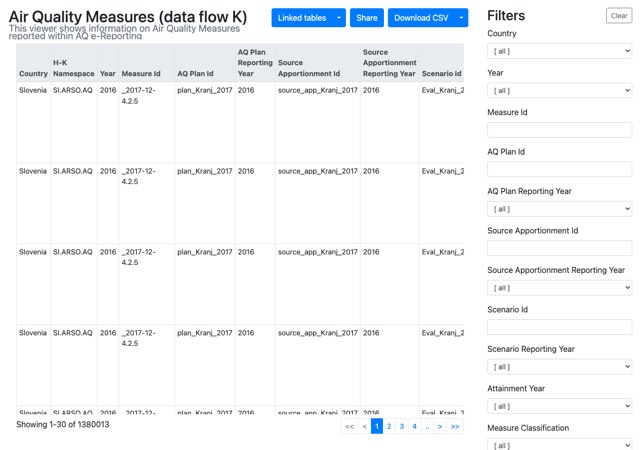
Air quality measures Consult information on air quality measures reported through data flow K. |
Click the image to open the interactive viewer. |