Data analysis and statistics
These applications provide statistical analyses of reported air quality data, support comparisons across countries and years, and give access to modelling results reported by Member States.
Air quality statistics
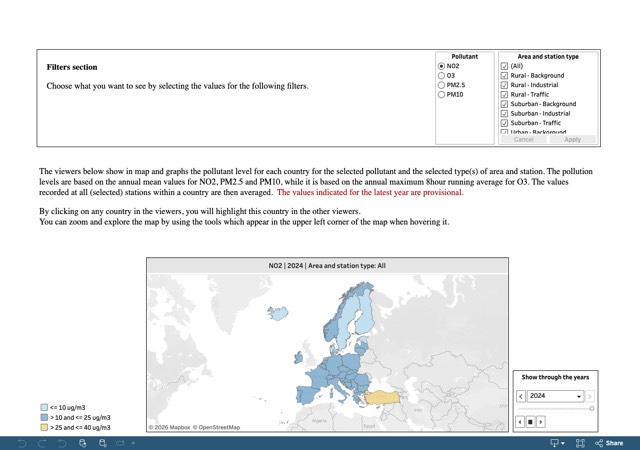
Country statistics Obtain a quick overview of annual air pollution levels for PM₁₀, PM₂.₅, NO₂ and O₃ averaged across all monitoring stations within each reporting country. |
Click the image to open the interactive viewer. |
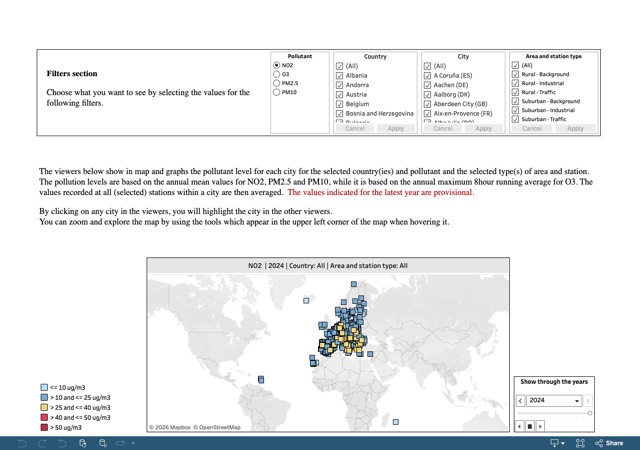
City statistics Explore annual air pollution levels averaged across all monitoring stations located within each city. |
Click the image to open the interactive viewer. |
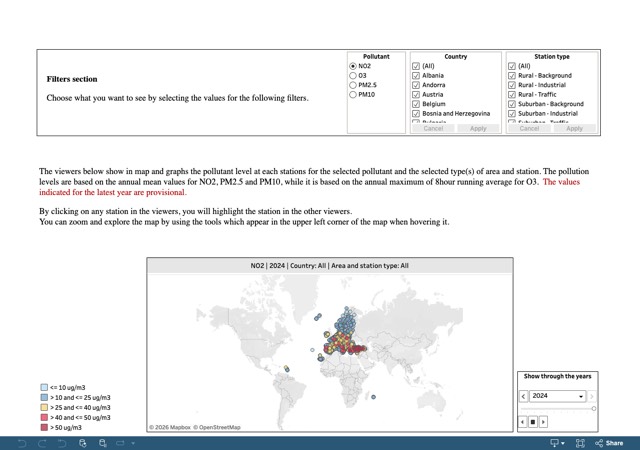
Station statistics Review annual air pollution levels for individual monitoring stations throughout Europe. |
Click the image to open the interactive viewer. |
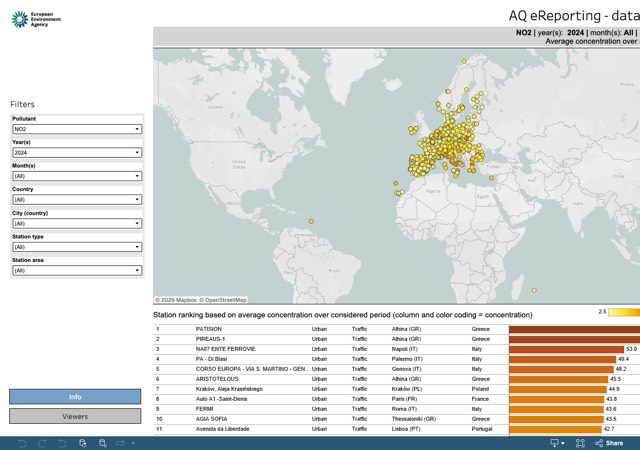
Daily, weekly and monthly concentrations Analyse the evolution of daily, weekly and monthly pollutant concentrations at station level. Stations can also be ranked according to their pollution levels. |
Click the image to open the interactive viewer. |
Statistical analysis
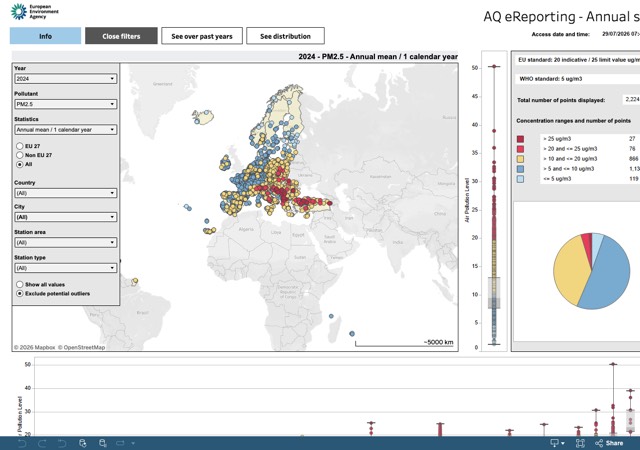
General statistical viewer Analyse all reported pollutants and statistical aggregations using maps, box plots, temporal trends and value distributions. |
Click the image to open the interactive viewer. |
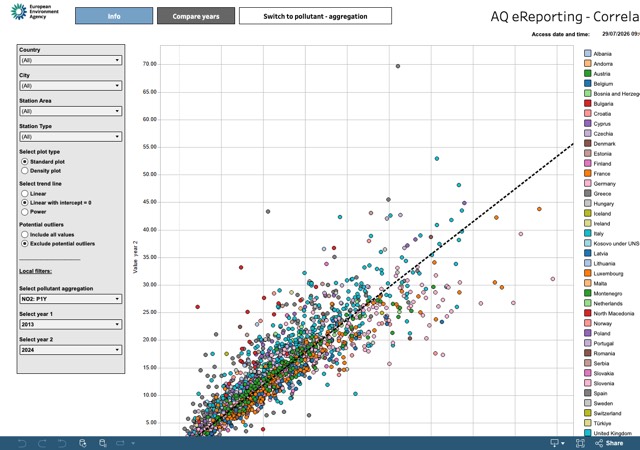
Correlation tool Compare different pollutants or statistical aggregations for the same reporting year, or compare identical indicators across different years. |
Click the image to open the interactive viewer. |
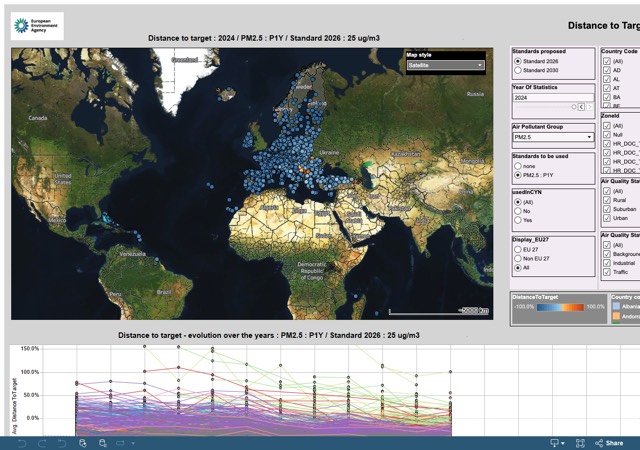
Distance to target Evaluate the distance to the air quality standards applicable from 2026 and from 2030 under the revised Ambient Air Quality Directive. |
Click the image to open the interactive viewer. |
Modelling
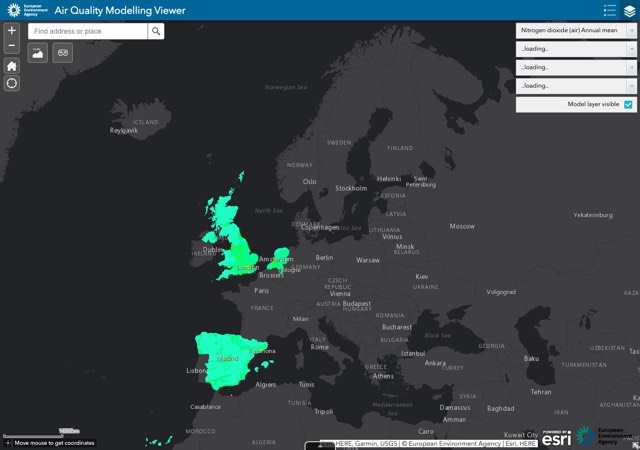
Modelling results Explore modelling results reported by Member States, including maps and associated model outputs. |
Click the image to open the interactive viewer. |